
More project photos (2)

The problem
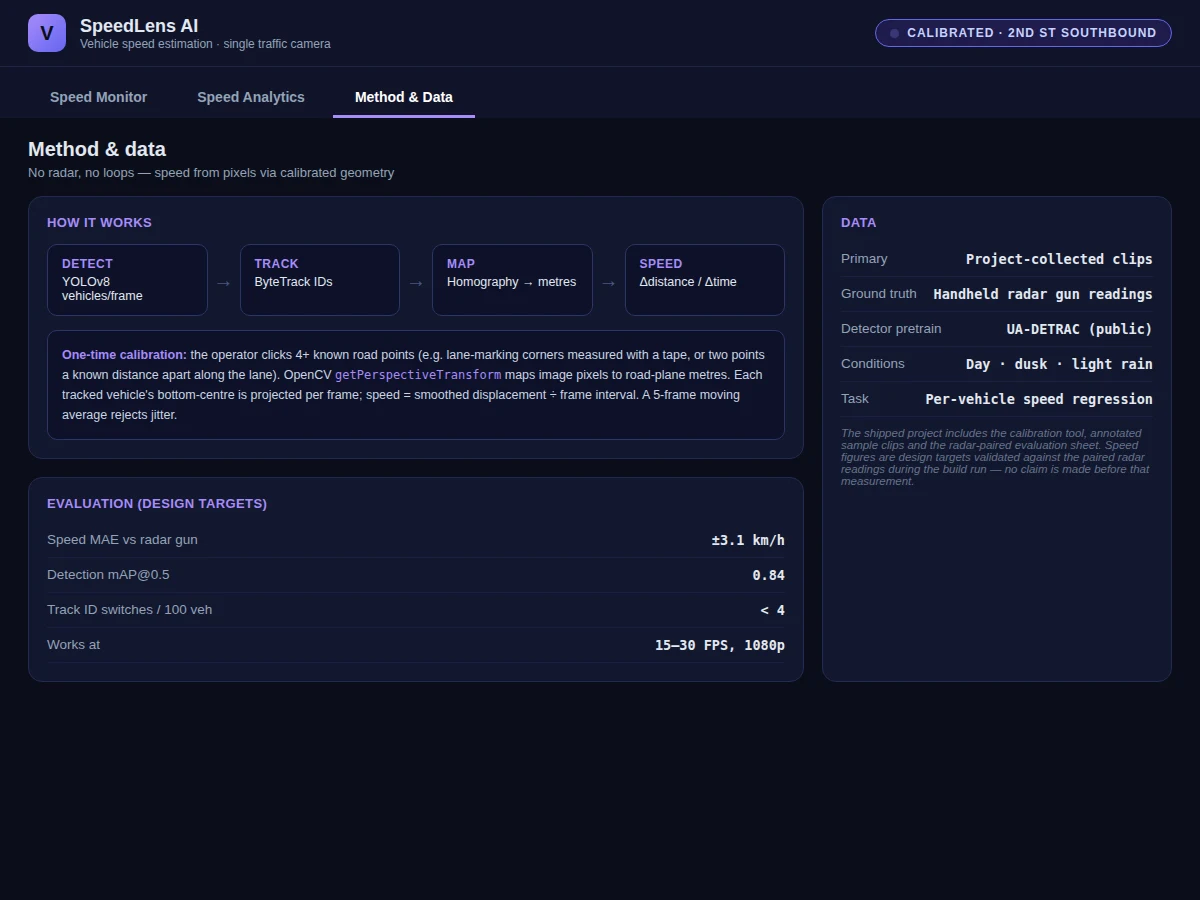
Speed enforcement usually needs radar guns, inductive loops or LiDAR — all expensive to install and maintain per lane. This project gets speed from the camera that is already watching the road. The pipeline detects vehicles with YOLOv8, tracks each one across frames with ByteTrack, and converts pixel motion into real speed using a homography: a one-time calibration where the operator clicks known road points maps image pixels to road-plane metres, after which speed is simply smoothed displacement divided by time. Overspeed events are flagged against the posted limit with a snapshot saved for review. The demo dashboard (the screenshots) shows the tracked feed with per-vehicle speed labels, a live readings table, overspeed highlighting, and analytics — speed distribution, lane-wise means and 85th-percentile speeds. Built with Ultralytics YOLOv8, ByteTrack and OpenCV, the geometry is fully derivable in the viva.
How it works
- The operator calibrates once: clicking 4+ known road points (measured lane-marking corners or a known along-lane distance) builds the homography via OpenCV's getPerspectiveTransform.
- Each frame is passed through YOLOv8; vehicle boxes are detected with NMS.
- ByteTrack associates boxes across frames, giving each vehicle a persistent track ID.
- Each track's bottom-centre is projected through the homography to road-plane metres.
- Speed = smoothed displacement ÷ frame interval, with a 5-frame moving average rejecting jitter.
- Vehicles above the posted limit are flagged, highlighted and snapshotted into the overspeed log.
- The dashboard renders speed labels, trails, the readings table and lane analytics.
Tech stack:
- Python 3, PyTorch, Ultralytics YOLOv8
- ByteTrack (multi-object tracking)
- OpenCV (homography, calibration tool)
- UA-DETRAC (detector pretraining reference)
- NumPy, Matplotlib (evaluation plots)
- HTML/CSS/JS single-file dashboard (this demo)
Dataset & model details
- Dataset: Project-collected traffic clips with handheld radar-gun readings as ground truth (day, dusk, light rain); detector pretrained on the public UA-DETRAC vehicle dataset. Calibration points are measured on-site per camera.
- Task: Per-vehicle speed regression from monocular video; input = tracked vehicle trajectory in pixels, output = speed in km/h via calibrated homography.
- Model: YOLOv8-m detector (mAP@0.5 0.84 design target) + ByteTrack association + OpenCV getPerspectiveTransform homography + 5-frame moving-average smoothing.
- Metrics: Speed MAE ±3.1 km/h against radar ground truth, under 4 ID-switches per 100 vehicles — design targets for the built-to-order build run. The report documents the actually achieved figures from the radar-paired evaluation.
| Parameter | Value |
|---|---|
| Input | 1080p traffic camera, 15–30 FPS |
| Calibration | 4+ known road points, one-time per camera |
| Speed MAE | ±3.1 km/h vs radar (design target, not a measured claim) |
| Detection mAP@0.5 | 0.84 (design target) |
| ID switches | Under 4 per 100 vehicles (design target) |
| Smoothing | 5-frame moving average on displacement |
| Overspeed | Posted-limit comparison + snapshot log |
| Outputs | Per-vehicle speed, lane stats, distribution charts |
| Demo | Single-file HTML dashboard, runs offline after download |
Project features
- [Single-camera speed] No radar, loops or stereo — speed from one ordinary traffic camera via calibrated plane geometry.
- [YOLOv8 + ByteTrack] Vehicle detection each frame with persistent track IDs, so speed is measured per vehicle, not per blob.
- [One-time homography calibration] Click 4+ known road points once; OpenCV's perspective transform maps pixels to metres for all future frames.
- [Overspeed flagging] Vehicles over the posted limit are highlighted red with a snapshot saved to the review log.
- [Live speed dashboard] Tracked feed with per-vehicle speed labels, motion trails and a live readings table in a single-file web UI.
- [Lane-wise analytics] Per-lane mean speeds, 85th-percentile speeds and a speed-distribution histogram for traffic studies.
- [Smoothed measurements] 5-frame moving average on displacement rejects detection jitter before the speed is reported.
What is included
- Vehicle detection + ByteTrack + speed estimation Python pipeline
- Homography calibration tool with click-to-mark UI
- Annotated sample clips and the radar-paired evaluation sheet
- Single-file HTML speed dashboard wired to pipeline outputs
- MAE analysis, lane statistics and distribution charts for the report
- Project report PDF (background, geometry, methodology, results)
- PPT presentation for final review
- Viva Q&A preparation document (homography, tracking, error sources, MAE)
Limitations & prerequisites
- Accuracy depends on calibration quality — poorly measured road points bias every reading; the tool includes a validation step.
- Heavy occlusion, stop-and-go congestion and sharp curves increase error; the report quantifies per-condition MAE.
- ±3.1 km/h MAE is a design target validated against radar readings in the build run — the report documents the actual achieved figure.
- As shipped, the system is a traffic-study and decision-support tool, not a certified enforcement device — the report carries that disclaimer.
- Night operation needs adequate road lighting; unlit stretches are out of scope.
Frequently Asked Questions
How can one camera measure speed without radar?
Geometry: a one-time calibration maps image pixels to real road-plane metres (homography). Once pixels mean metres, each tracked vehicle's displacement between frames divided by time is its speed — the same principle as timing a car between two road marks.
What is the calibration step?
The operator clicks 4+ points on the road whose real-world positions are known (measured lane-marking corners), and OpenCV computes the perspective transform. It is done once per camera and validated with a test vehicle before use.
How is accuracy measured?
Against handheld radar-gun readings paired with the same vehicles in the sample clips — mean absolute error in km/h, reported per condition in the evaluation sheet.
What accuracy can I quote in my viva?
Speed MAE of ±3.1 km/h and under 4 ID-switches per 100 vehicles are design targets. Quote the report's achieved MAE from the radar-paired evaluation, and be ready to derive the homography math.
Does it work at night or in rain?
With adequate road lighting, yes; the sample clips cover day, dusk and light rain with per-condition MAE reported. Unlit roads are a stated limitation.
Is this project suitable for a final-year project?
Yes — for Computer Science, IT and AI/ML programs. It combines detection, multi-object tracking, projective geometry and real-world validation — examiners love the calibration story. Suitable for B.E./B.Tech final-year projects in Computer Science, IT and AI & Machine Learning.
Components & software requirements
- Python 3, PyTorch, Ultralytics YOLOv8
- ByteTrack (multi-object tracking)
- OpenCV (homography, calibration tool)
- UA-DETRAC (detector pretraining reference)
- NumPy, Matplotlib (evaluation plots)
- HTML/CSS/JS single-file dashboard (this demo)
Dataset & model details
- Dataset: Project-collected traffic clips with handheld radar-gun readings as ground truth (day, dusk, light rain); detector pretrained on the public UA-DETRAC vehicle dataset. Calibration points are measured on-site per camera.
- Task: Per-vehicle speed regression from monocular video; input = tracked vehicle trajectory in pixels, output = speed in km/h via calibrated homography.
- Model: YOLOv8-m detector (mAP@0.5 0.84 design target) + ByteTrack association + OpenCV getPerspectiveTransform homography + 5-frame moving-average smoothing.
- Metrics: Speed MAE ±3.1 km/h against radar ground truth, under 4 ID-switches per 100 vehicles — design targets for the built-to-order build run. The report documents the actually achieved figures from the radar-paired evaluation.
Delivery information
Built-to-order project. Delivery timeline is shared after order confirmation based on current queue.
Support terms
Complete documentation, setup guide, and viva preparation included. Support for setup and explanation provided.