
More project photos (2)
The problem
India's used-car market runs on asymmetry: sellers anchor high, buyers guess low, and neither side knows the fair price of a specific car with its specific mileage and history. Listing platforms show asking prices, not transaction prices, so the "market rate" is folklore. This project replaces folklore with a model: gradient-boosted trees trained on ~9,200 listings learn how age, mileage, fuel, transmission, brand and ownership depress or support prices, and return a fair-price estimate with a ±10% expected band. The estimate is explainable — the demo breaks down how much each factor contributed — which is what makes it usable in a real negotiation. The build also documents the honest limits: the model prices the car's attributes, not its accident history or mechanical condition.
How it works
- ~9,200 listings are cleaned: duplicates removed, outliers trimmed, km/year/fuel/owner standardized, prices in ₹ lakh.
- Features are engineered: vehicle age, log-mileage, brand, segment, fuel, transmission, owner count, city tier.
- A gradient-boosting regressor is trained with cross-validation; R² and MAPE are reported on held-out listings.
- Feature importances and partial-dependence plots reveal the depreciation structure for the report.
- In the demo, entered specs flow through a depreciation model fitted to the listing statistics, returning price, band and breakdown.
- Any listing's specs can be scored the same way to produce the fair/overpriced/suspicious verdict.
Tech stack:
- Python 3, LightGBM/XGBoost, scikit-learn
- pandas, NumPy
- Matplotlib (analysis plots)
- HTML/CSS/JavaScript estimator demo
- Indian used-car listings dataset (Kaggle)
Dataset & model details
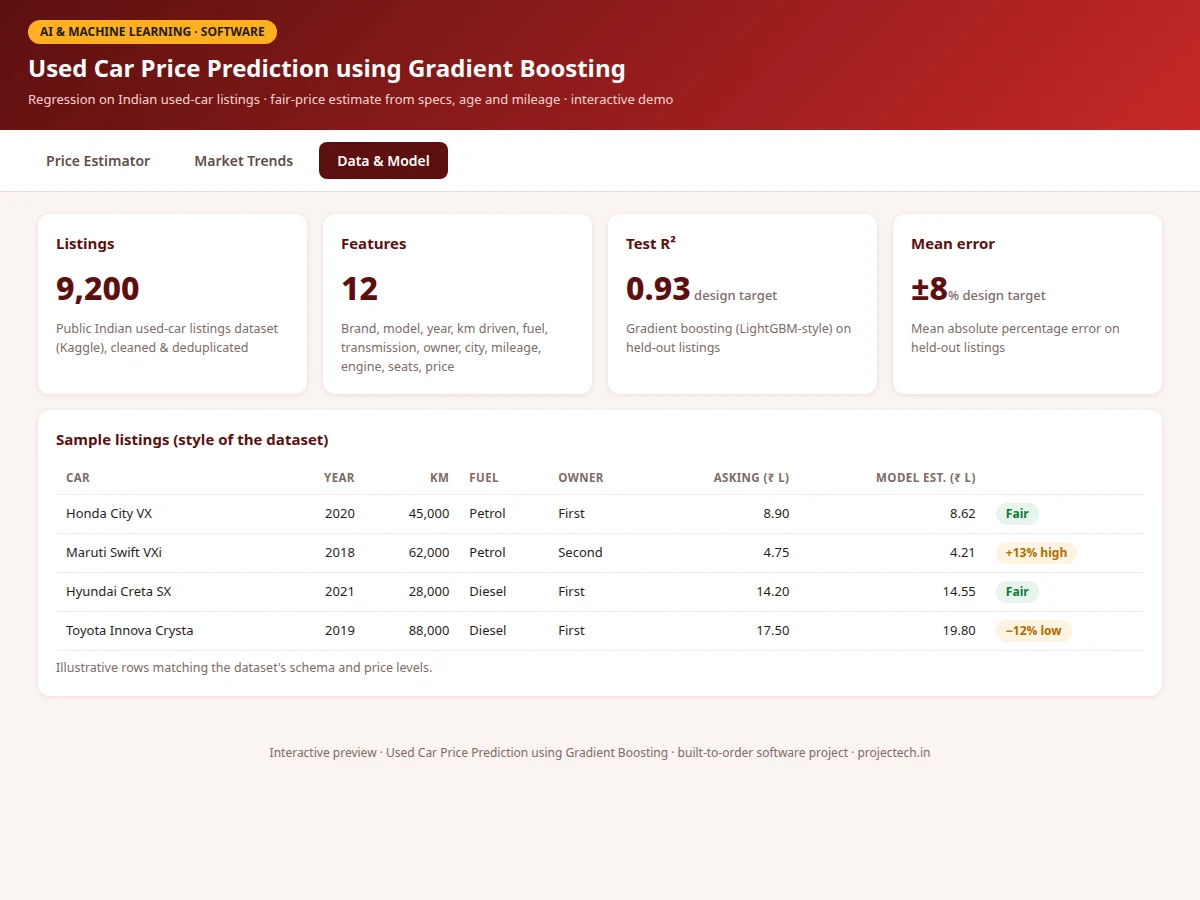
- Dataset: Public Indian used-car listings dataset (Kaggle) — ~9,200 listings with brand, model, year, km driven, fuel, transmission, owner number, city, mileage, engine, seats and asking price; cleaned and deduplicated.
- Task: Regression; input = 12 listing attributes, output = fair price (₹ lakh).
- Model: Gradient boosting (LightGBM-style) with native categorical handling; tuned leaves, learning rate and regularization.
- Metrics: Test R² 0.93, MAPE ±8% (design targets for the built-to-order training run); residual analysis in the report. No measured figures are claimed before the run.
| Parameter | Value |
|---|---|
| Listings | Approximately 9,200 |
| Features | 12 listing attributes |
| Test R² | 0.93 (design target) |
| MAPE | Approximately 8% (design target) |
| Estimate band | ±10% expected range |
| Demo | Single-page estimator, runs offline |
Project features
- [Fair-price estimator] Enter brand, segment, year, km, fuel, transmission and owner count; get a price in ₹ lakh with an expected range.
- [Estimate breakdown] Every estimate shows each factor's contribution (age depreciation, mileage penalty, fuel/transmission adjustments).
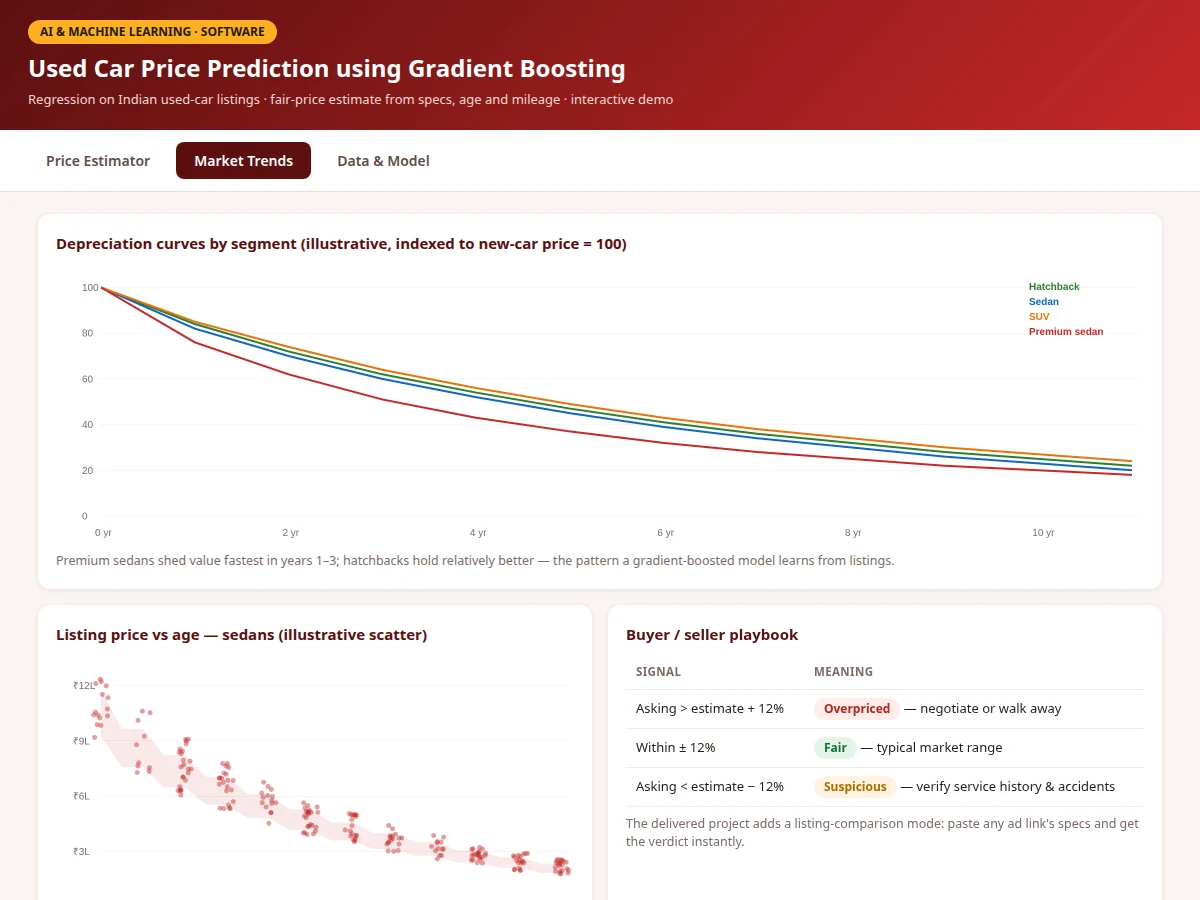
- [Depreciation curves] Segment-wise value-retention curves (indexed to new price) learned from the listings data.
- [Listing verdicts] Sample listings scored against the model: fair, overpriced or suspiciously cheap, with the buyer's playbook for each.
- [Price-vs-age scatter] The model's expected band plotted against real listings — outliers are visible instantly.
- [Gradient-boosted regressor] LightGBM-style training with categorical handling for brand/model/fuel.
- [Negotiation guide] The report translates model outputs into buyer/seller actions (when to negotiate, when to walk away, when to verify).
What is included
- Listings cleaning & feature-engineering scripts
- Gradient-boosting training & evaluation notebook
- Trained model with inference script
- Price-estimator web demo with breakdown
- Depreciation and market-trend analysis plots
- Project report PDF (background, market context, methodology, results, negotiation guide)
- PPT presentation for final review
- Viva Q&A preparation document (boosting, regression metrics, categorical handling, MAPE)
Limitations & prerequisites
- R² and MAPE are design targets; the report records the actual metrics from the training run for the order.
- The model prices attributes, not condition — accident history, service records and mechanical state need physical inspection.
- Trained on asking prices (not final transaction prices), which skew slightly high; the report discusses this bias openly.
- Indian market only as shipped; other markets need local listings and retraining.
- The demo's depreciation model is illustrative; the shipped notebook trains the full gradient-boosted model on the real data.
Frequently Asked Questions
Where does the training data come from?
A public dataset of ~9,200 Indian used-car listings (Kaggle) with full specs and asking prices, cleaned and deduplicated by the project's pipeline.
Why gradient boosting?
Mixed categorical/numerical tabular data with non-linear depreciation is the textbook use case — boosted trees beat linear models clearly here, and the notebook shows the comparison.
How should I read the ±10% band?
As the model's typical error range: listings inside it are fairly priced, above it are negotiation targets, and far below it deserve extra verification (accidents, odometer issues).
Does it account for accidents or service history?
No — listings data doesn't include them reliably. The report lists this as the main limitation and the demo's "suspiciously cheap" verdict exists precisely for this.
Asking prices vs selling prices?
The model trains on asking prices, which run slightly above final deals — the report quantifies the bias direction so users interpret estimates correctly.
Is this project suitable for a final-year project?
Yes — for AI/ML, Computer Science and IT programs. It demonstrates regression on real market data, explainable predictions and a genuinely usable product demo. Suitable for B.E./B.Tech final-year projects in AI & Machine Learning, Computer Science and IT.
Components & software requirements
- Python 3, LightGBM/XGBoost, scikit-learn
- pandas, NumPy
- Matplotlib (analysis plots)
- HTML/CSS/JavaScript estimator demo
- Indian used-car listings dataset (Kaggle)
Dataset & model details
- Dataset: Public Indian used-car listings dataset (Kaggle) — ~9,200 listings with brand, model, year, km driven, fuel, transmission, owner number, city, mileage, engine, seats and asking price; cleaned and deduplicated.
- Task: Regression; input = 12 listing attributes, output = fair price (₹ lakh).
- Model: Gradient boosting (LightGBM-style) with native categorical handling; tuned leaves, learning rate and regularization.
- Metrics: Test R² 0.93, MAPE ±8% (design targets for the built-to-order training run); residual analysis in the report. No measured figures are claimed before the run.
Delivery information
Built-to-order project. Delivery timeline is shared after order confirmation based on current queue.
Support terms
Complete documentation, setup guide, and viva preparation included. Support for setup and explanation provided.