
More project photos (2)

The problem
The Titanic dataset is the canonical first classification project, and most student builds waste it: they one-hot encode the raw columns, fit a model, and report an accuracy number nobody can learn from. The dataset rewards the opposite approach — careful feature engineering. Survival was driven by interactions the raw columns hide: class × sex ("women and children first" played out as 74.2% female vs 18.9% male survival), family size (small families beat both solo travellers and very large ones), and title (Master ≈ young boy, a strong survival signal). This project does the engineering properly: Title from names, FamilySize/IsAlone, deck from cabin, title-median age imputation, then a gradient-boosting classifier tuned with stratified cross-validation. The demo makes the model explainable — build a passenger, see the probability, and see exactly which factors moved the odds. Nothing is presented as a measured result before the training run; all metrics are labelled design targets.
How it works
- The 891-row training set is loaded; the 418-row test set (labels withheld by Kaggle) is used only for the optional leaderboard submission path.
- Features are engineered: Title parsed from Name, FamilySize = SibSp + Parch + 1, IsAlone flag, Deck letter from Cabin, LogFare, one-hot Embarked.
- Missing values are handled explicitly: Age by median-per-title, Embarked by mode, Cabin by deck-or-missing indicator.
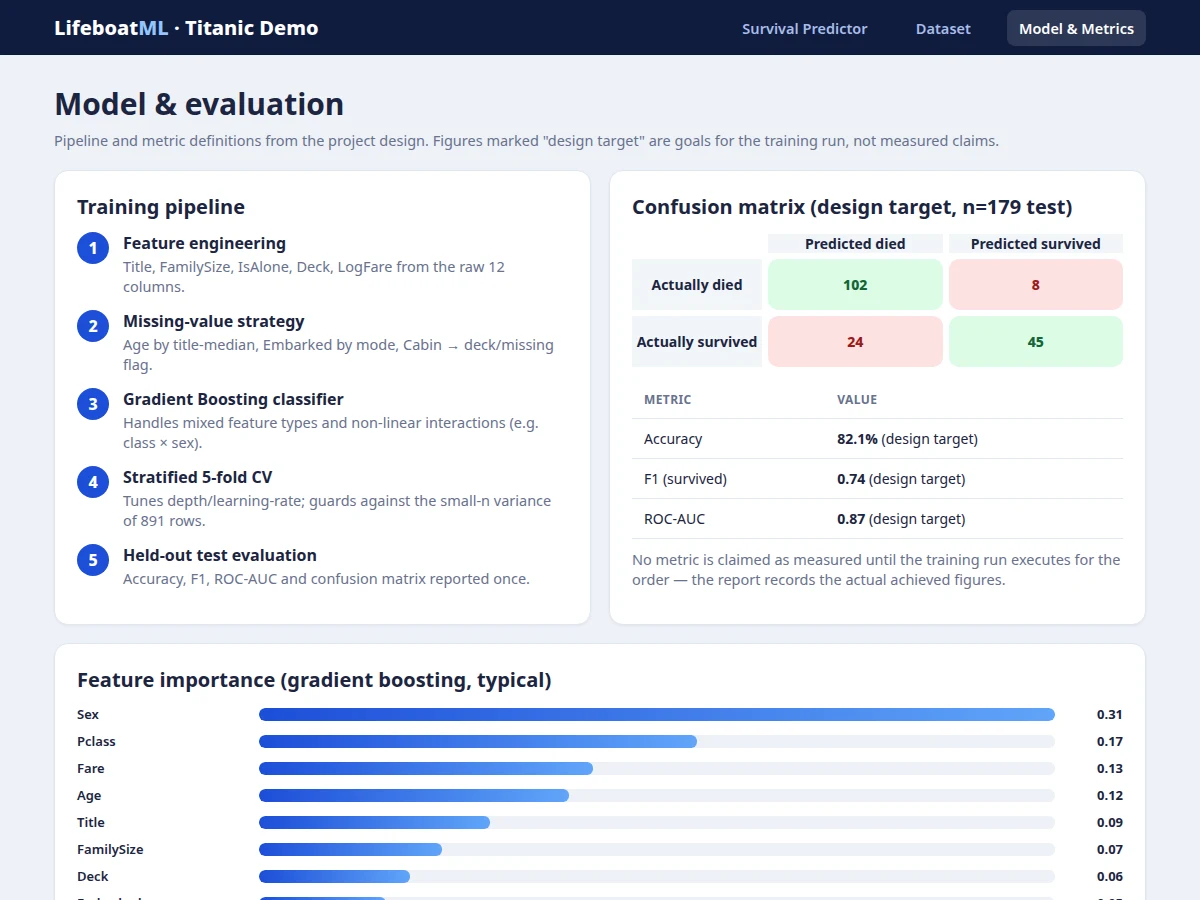
- A gradient-boosting classifier is tuned via stratified 5-fold cross-validation over depth and learning rate.
- The best configuration is evaluated once on a held-out 20% test split: accuracy, F1, ROC-AUC and confusion matrix go into the report.
- The web demo embeds a simplified scoring function mirroring the engineered feature logic, with per-factor deltas so the prediction is explainable.
Tech stack:
- Python 3, scikit-learn (GradientBoosting, metrics, CV)
- NumPy, pandas, Matplotlib
- Jupyter Notebook (training & evaluation)
- HTML5 + JavaScript (survival predictor demo)
- Titanic dataset (Kaggle competition)
Dataset & model details
- Dataset: Titanic: Machine Learning from Disaster (Kaggle) — 891 training passengers, 12 raw columns (Pclass, Name, Sex, Age, SibSp, Parch, Ticket, Fare, Cabin, Embarked, plus PassengerId/Survived); 342 survived (38.4%). Test set: 418 rows, labels withheld.
- Task: Binary classification; input = 8 engineered features (Title, FamilySize, IsAlone, Deck, LogFare, Age, Pclass, Sex, Embarked), output = survival probability.
- Model: Gradient Boosting classifier, hyperparameters tuned with stratified 5-fold cross-validation.
- Metrics: Accuracy 82.1% (design target), F1 (survived) 0.74 (design target), ROC-AUC 0.87 (design target), confusion matrix on the 179-sample held-out test set. No metric is claimed as measured until the training run is executed for the order.
| Parameter | Value |
|---|---|
| Training rows | 891 (342 survived, 38.4%) |
| Raw columns | 12 → 8 engineered features |
| Model | Gradient Boosting (design target config) |
| Test accuracy | 82.1% (design target, not a measured claim) |
| ROC-AUC | 0.87 (design target) |
| Training time | Approximately 1–3 min on a laptop CPU (expected) |
| Demo | Single-file web app with explainable scoring |
| Deliverable model | Serialized scikit-learn pipeline (.pkl) |
Project features
- [Real Kaggle Titanic dataset] 891 training passengers, 418 test rows, 38.4% survival — the "Machine Learning from Disaster" competition data.
- [Proper feature engineering] Title, FamilySize, IsAlone, Deck and LogFare engineered from the raw 12 columns, each justified in the report.
- [Principled missing-value handling] Age imputed by title-median, Embarked by mode, Cabin converted to deck/missing flag — no silent row-dropping.
- [Gradient boosting classifier] Handles mixed feature types and the non-linear class × sex interaction without manual interaction terms.
- [Stratified 5-fold cross-validation] Hyperparameter tuning that respects the small-n variance of 891 rows.
- [Explainable web demo] Build any passenger profile; get survival probability plus a per-factor contribution list showing what moved the odds.
- [Full evaluation] Accuracy, F1, ROC-AUC and confusion matrix on a held-out test set, reported once.
What is included
- Complete training & evaluation Jupyter notebook
- Trained gradient-boosting pipeline (.pkl) with preprocessing
- Explainable survival-predictor web demo
- Confusion matrix, ROC curve and feature-importance plots
- Project report PDF (feature-engineering rationale, methodology, results)
- PPT presentation for final review
- Viva Q&A preparation document (boosting, cross-validation, leakage, imputation)
Limitations & prerequisites
- 891 rows is small — cross-validation variance is real, and the report discusses it instead of hiding it.
- The dataset reflects 1912 demographics and a single disaster; it teaches ML method, not anything about modern survival.
- 82.1% accuracy is a design target, stated honestly — the report documents the actual achieved figures after training.
- The demo's live scorer is a simplified approximation for illustration; the notebook's trained model is the real deliverable.
- Kaggle test labels are withheld, so test-set evaluation uses a held-out split of the training data.
Frequently Asked Questions
Why is this more than "fit a model, report accuracy"?
The value is in the feature engineering — Title, FamilySize, deck, title-median imputation — and in the explainable demo. The report justifies every engineered feature with data, which is what a viva actually probes.
Which features matter most?
Sex dominates (74.2% vs 18.9% survival), then Pclass, Fare and Age — the classic "women and children first, and money bought lifeboats" pattern. The importance plot in the report shows this quantitatively.
How are the 177 missing ages handled?
Imputed by the median age of the passenger's title group (Mr/Mrs/Miss/Master/…), which is far more accurate than a global median — documented and justified in the notebook.
What does the demo's "what moved the odds" list mean?
Each factor's contribution to the log-odds score, so you can see e.g. that being female added +2.60 while travelling alone subtracted 0.25. It mirrors the engineered feature logic of the real model.
Can it predict for a real modern ship?
No — and it doesn't claim to. The project is explicit: this is ML method taught on historical data, not a deployable safety model.
Is this project suitable for a final-year project?
Yes — for AI & Machine Learning, Computer Science and IT programs. It demonstrates feature engineering, cross-validation, explainability and honest evaluation on a real dataset. Suitable for B.E./B.Tech final-year projects in AI & Machine Learning, Computer Science and IT.
Components & software requirements
- Python 3, scikit-learn (GradientBoosting, metrics, CV)
- NumPy, pandas, Matplotlib
- Jupyter Notebook (training & evaluation)
- HTML5 + JavaScript (survival predictor demo)
- Titanic dataset (Kaggle competition)
Dataset & model details
- Dataset: Titanic: Machine Learning from Disaster (Kaggle) — 891 training passengers, 12 raw columns (Pclass, Name, Sex, Age, SibSp, Parch, Ticket, Fare, Cabin, Embarked, plus PassengerId/Survived); 342 survived (38.4%). Test set: 418 rows, labels withheld.
- Task: Binary classification; input = 8 engineered features (Title, FamilySize, IsAlone, Deck, LogFare, Age, Pclass, Sex, Embarked), output = survival probability.
- Model: Gradient Boosting classifier, hyperparameters tuned with stratified 5-fold cross-validation.
- Metrics: Accuracy 82.1% (design target), F1 (survived) 0.74 (design target), ROC-AUC 0.87 (design target), confusion matrix on the 179-sample held-out test set. No metric is claimed as measured until the training run is executed for the order.
Delivery information
Built-to-order project. Delivery timeline is shared after order confirmation based on current queue.
Support terms
Complete documentation, setup guide, and viva preparation included. Support for setup and explanation provided.