
More project photos (4)
The problem
Operating systems ship a task manager, but it forgets everything: no history, no alerts, no export, and no way to say "tell me when this server's disk fills up." This project builds the missing tool — a native desktop application in Python that continuously samples CPU, memory, disk and network counters, draws them as live updating graphs, and watches them against alert rules the user defines. The architecture is a clean producer/consumer split: a sampler thread polls psutil at the configured interval and pushes samples into a ring buffer; the Qt event loop renders the charts and evaluates thresholds without blocking. History persists in SQLite so graphs can be reviewed across restarts and exported to CSV. Because every reading comes from real OS counters on the machine it runs on, the demo is live and un-fakeable — the CPU graph spikes the moment you open another program — which makes reviews and vivas easy to carry.
How it works
- A background QThread samples psutil.cpu_percent (percpu), virtual_memory, disk_usage, disk_io_counters and net_io_counters every N seconds (default 1 s).
- Samples land in a fixed-size ring buffer in memory and are flushed to SQLite in batches, keeping the UI thread free for rendering.
- Matplotlib canvases embedded in PyQt6 widgets redraw from the buffer on a Qt timer, giving smooth live graphs with a trailing time window.
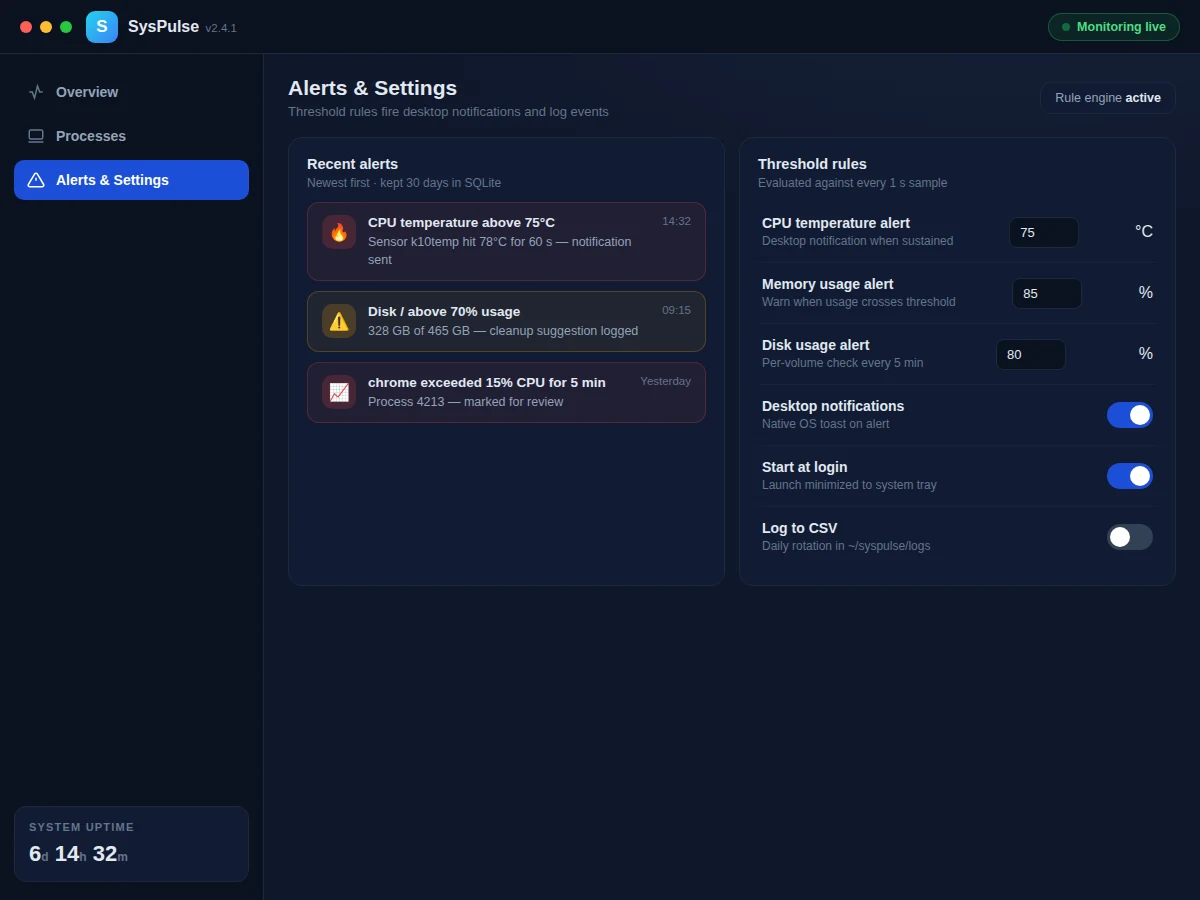
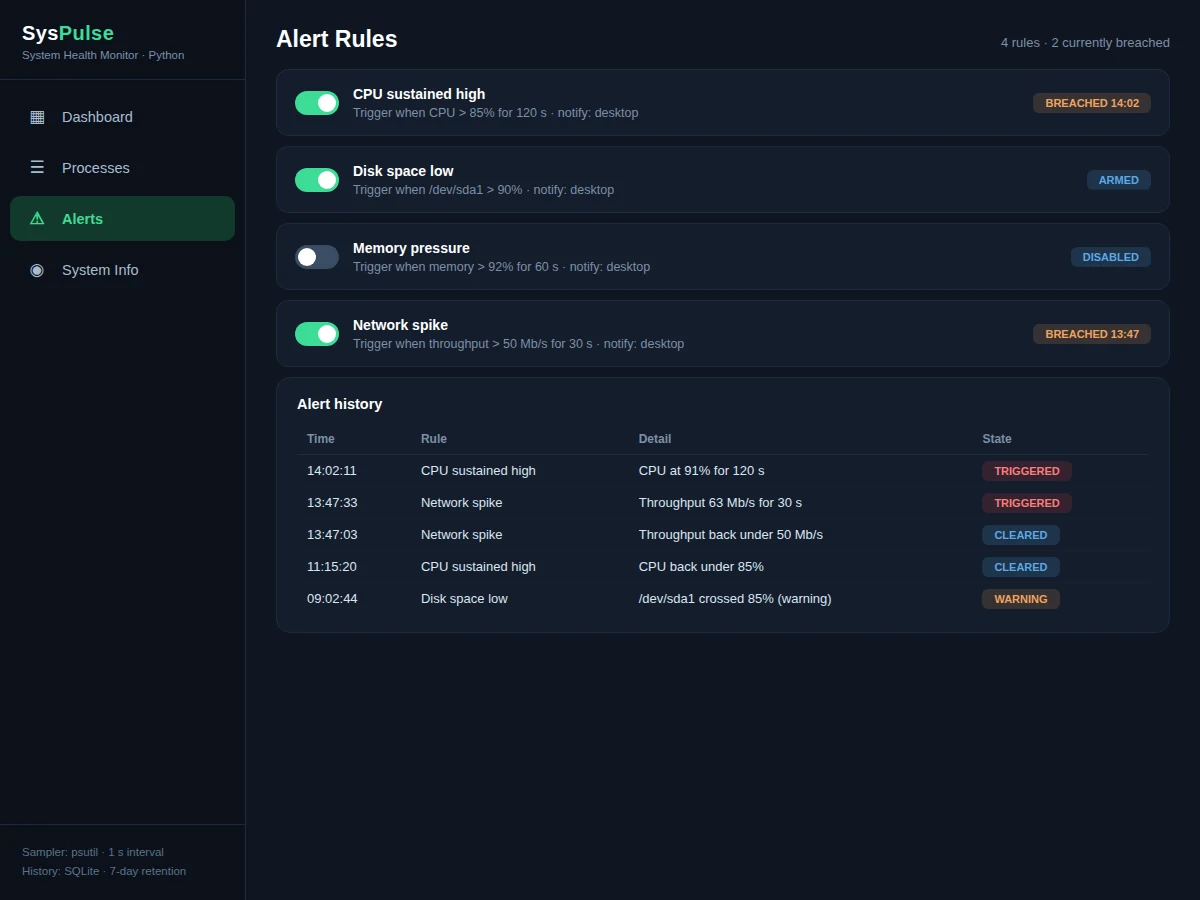
- The alert engine evaluates each rule against the buffered window each cycle; on trigger it posts a Qt system-tray/desktop notification and writes an alert row to the database.
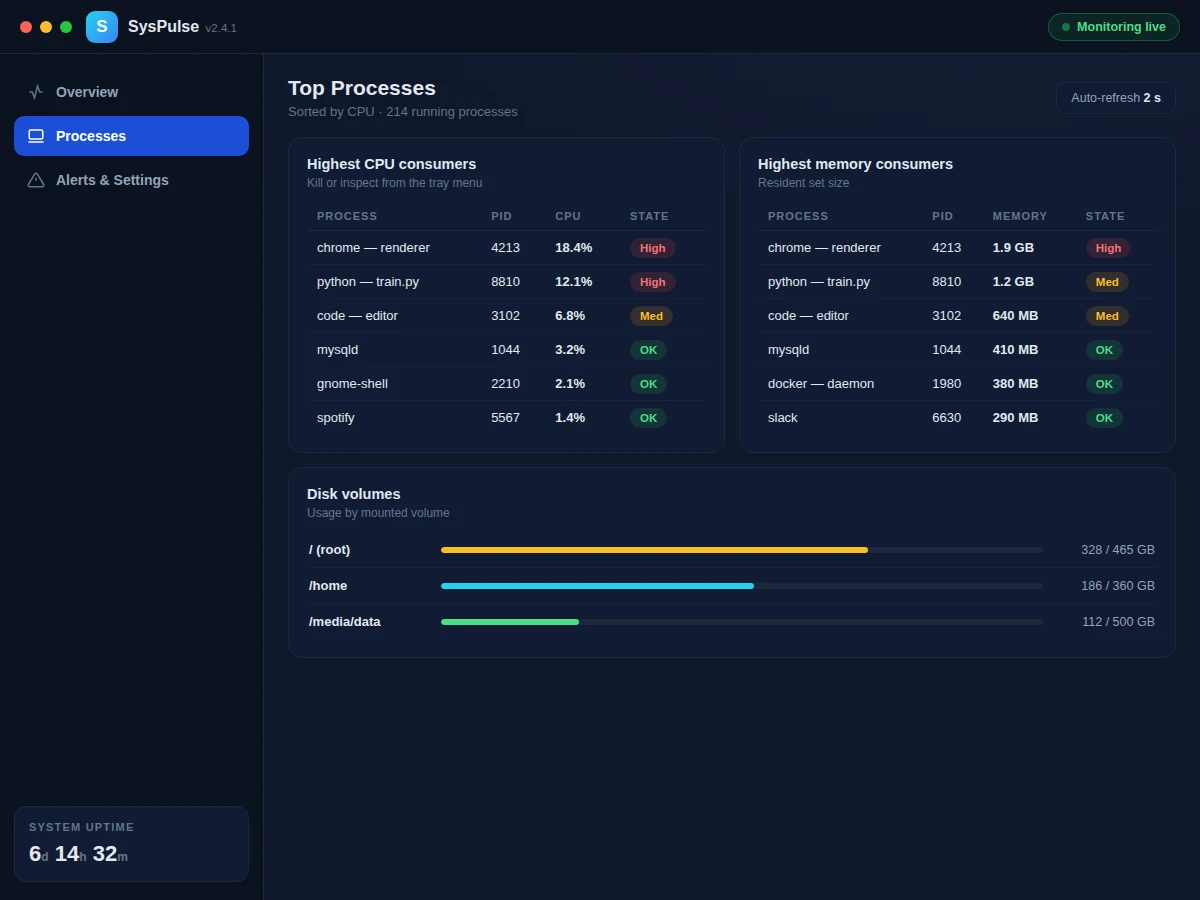
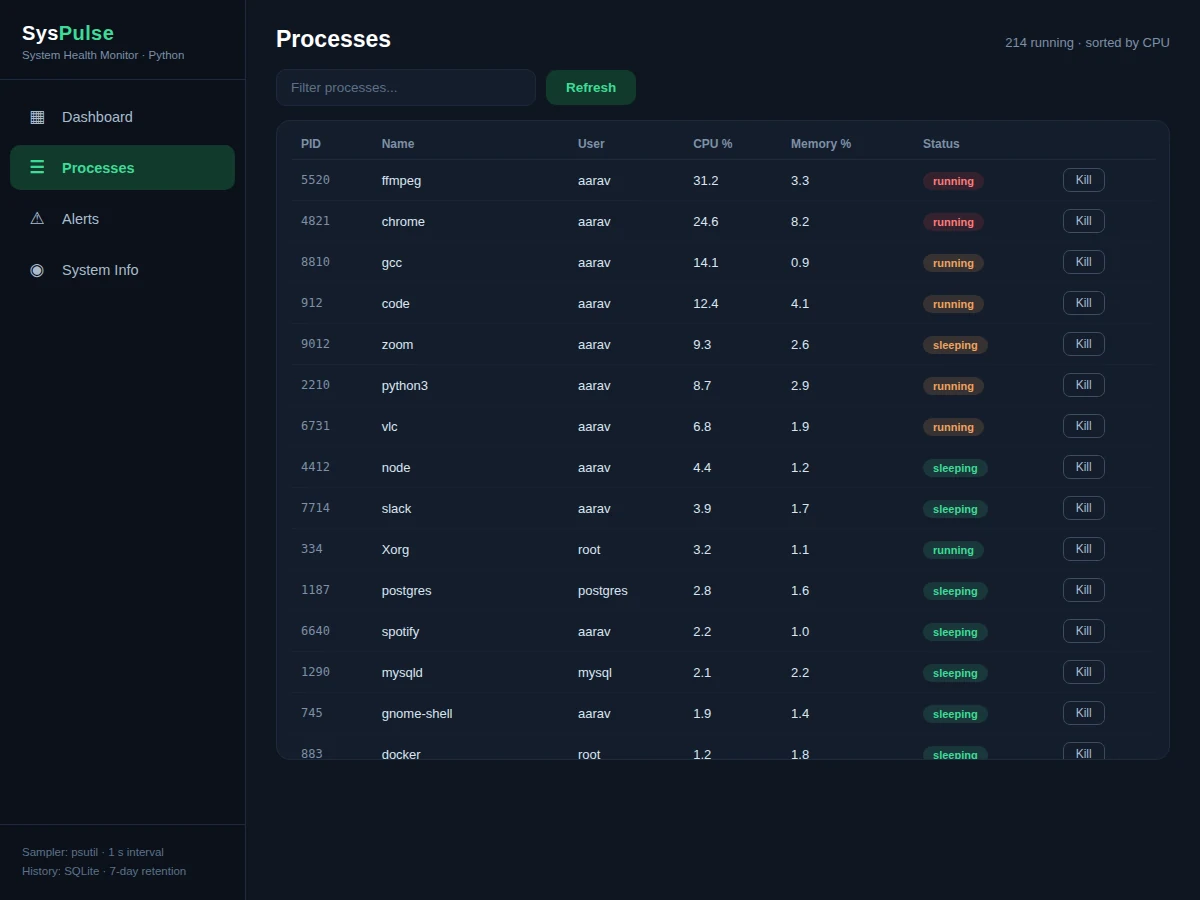
- The process view refreshes from psutil.process_iter with oneshot CPU/memory reads, sorted by the clicked column; kill requests go through psutil's terminate with confirmation.
- The history view queries SQLite by metric and time range, renders the replay chart, and exports the selection to CSV.
Tech stack:
- Python 3.11, PyQt6 (desktop UI, system tray, notifications)
- psutil (cross-platform CPU, memory, disk, network and process counters)
- matplotlib (live and history charts embedded in Qt)
- SQLite (metric history, alert rules, alert log)
- PyInstaller build spec for a one-click Windows executable
| Parameter | Value |
|---|---|
| Language / UI | Python 3.11, PyQt6 desktop application |
| Metric source | psutil OS counters (CPU, memory, disk, network, processes) |
| Sampling | 1 s default, configurable 0.5–60 s; ring buffer + batched SQLite writes |
| Charts | Live line/area charts; history replay with zoom; CSV export |
| Alerts | Threshold + duration rules on any metric; desktop notification + log |
| Storage | Local SQLite (history, rules, alert log); retention configurable |
| Platforms | Windows 10/11, Linux, macOS (psutil is cross-platform) |
| Packaging | PyInstaller one-file build spec included |
Project features
- [Live metric dashboards] CPU (overall + per-core), memory, swap, disk usage and network up/down rendered as continuously updating line and area charts with a configurable sampling interval.
- [Process manager] Sortable process table with PID, name, user, CPU%, memory and status; refresh, kill and priority views with a search filter.
- [Threshold alert rules] User-defined rules such as "CPU > 85% for 120 s" or "disk C: > 90%" that trigger desktop notifications and log to the alert history.
- [History logging] Every sample persisted to SQLite; the history view replays any metric over the last hour/day with zoomable charts and CSV export.
- [System information panel] OS, hostname, CPU model and core count, total RAM, disk partitions, network interfaces and boot time in one reference view.
- [Dark and light themes] Two polished themes; the layout adapts to window resizing and remembers its geometry between runs.
- [Configurable and honest] All thresholds, intervals and retention periods are user settings — nothing is hard-coded; readings are always labeled with their source counter.
What is included
- Complete Python source (sampler thread, alert engine, Qt views, SQLite layer)
- PyInstaller build spec for packaging a standalone executable
- Project report PDF (architecture, threading model, psutil counter reference, testing)
- PPT presentation for final review
- Viva Q&A preparation document (threads vs processes, Qt signals/slots, psutil, SQLite, OS counters)
- Setup guide (virtualenv, pip install, running from source, building the exe)
Limitations & prerequisites
- It monitors the machine it runs on — there is no remote-agent or fleet dashboard; one instance watches one host.
- Killing processes requires the OS privileges of the logged-in user; system processes may refuse and the app reports that honestly.
- Readings are OS counters, not calibrated instruments — brief sampling jitter on busy systems is normal and documented.
- Alert delivery is a local desktop notification; there is no SMS/email/push channel in this build.
- Historical depth is bounded by the retention setting (default 7 days) to keep the SQLite file small.
Frequently Asked Questions
Is the data real or simulated?
Real. Every value comes from psutil reading the host OS counters live — open another application and watch the CPU graph react. Nothing in the app is hard-coded or simulated.
Can it monitor another computer over the network?
No — this build is a single-host desktop app. Remote monitoring would need an agent + server architecture, which is documented as future scope.
Which OS does it run on?
Windows 10/11, Linux and macOS — psutil and PyQt6 are cross-platform. A PyInstaller spec is included for building a one-click Windows executable.
How do the alerts work?
You define rules (metric, threshold, sustained duration); the alert engine checks them each sampling cycle and raises a desktop notification plus a log entry when a rule stays breached for the configured duration.
What gets stored, and where?
Metric samples, alert rules and the alert log go into a local SQLite database with a configurable retention period (default 7 days); nothing leaves the machine.
Is this project suitable for a final-year project?
Yes — for Computer Science and IT programs. It demonstrates threading, event-driven GUI design, OS-level metrics, database persistence and a genuinely useful tool, all strong viva material. Suitable for B.E./B.Tech final-year projects in Computer Science and IT.
Components & software requirements
- Python 3.11, PyQt6 (desktop UI, system tray, notifications)
- psutil (cross-platform CPU, memory, disk, network and process counters)
- matplotlib (live and history charts embedded in Qt)
- SQLite (metric history, alert rules, alert log)
- PyInstaller build spec for a one-click Windows executable
Delivery information
Built-to-order project. Delivery timeline is shared after order confirmation based on current queue.
Support terms
Complete documentation, setup guide, and viva preparation included. Support for setup and explanation provided.