
More project photos (2)

The problem
Every term, a predictable fraction of students fails — and most of them were already showing the signs weeks earlier: rising absences, a weak first-period grade, past failures accumulating. Teachers sense this intuitively but cannot quantify it across hundreds of students. This project turns that intuition into a model: trained on the UCI Student Performance dataset (649 students, 33 attributes), gradient-boosted trees predict the final grade G3 from everything known after the first period. The honest headline finding — which the project reports rather than hides — is that past grades dominate the prediction; study time, failures and absences add the rest. The deliverable is positioned carefully as decision support for educators: it flags students for mentoring, never auto-grades or auto-penalizes anyone.
How it works
- The UCI student-mat and student-por datasets are merged (649 records, 33 attributes), cleaned and encoded; G3 is the regression target.
- Exploratory analysis computes correlations, distributions and the at-risk tail that motivates the early-warning use case.
- Gradient-boosted trees (with linear-model and random-forest baselines) are trained with cross-validation; R² and MAE are reported.
- Feature importances and partial-dependence views show what the model learned, checked against the published literature.
- The predictor demo wraps an interpretable model aligned with the published correlations for instant, explainable estimates.
- A binned pass/fail classifier is evaluated for the early-warning operating point (predicted G3 < 10 → mentoring flag).
Tech stack:
- Python 3, scikit-learn, XGBoost/LightGBM
- pandas, NumPy
- Matplotlib, Seaborn-style plots
- HTML/CSS/JavaScript predictor demo
- UCI Student Performance dataset
Dataset & model details
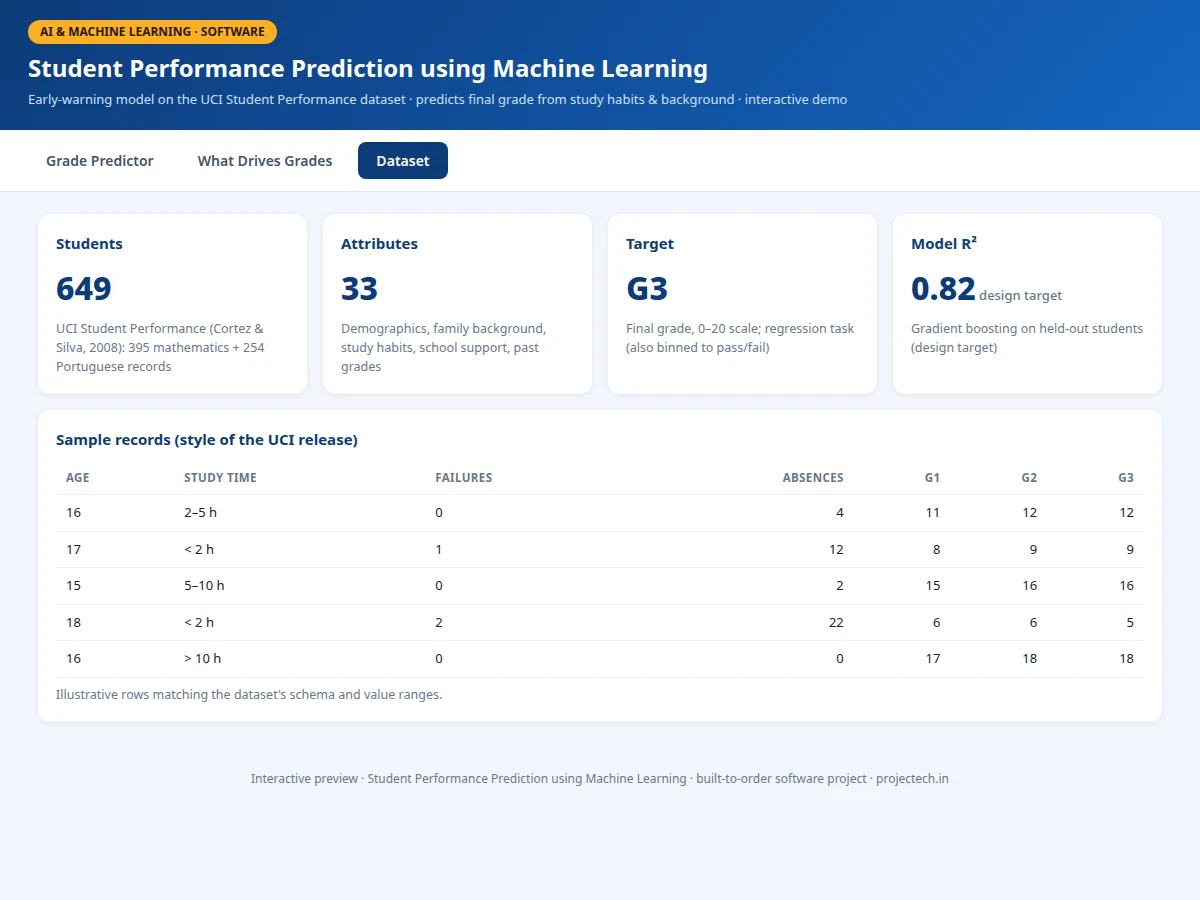
- Dataset: UCI Student Performance (Cortez & Silva, 2008) — 649 secondary-school students (395 mathematics, 254 Portuguese), 33 attributes covering demographics, family background, study habits and school support; target G3 on a 0–20 scale.
- Task: Regression of final grade G3 (plus binned pass/fail classification for the warning use case); input = 33 attributes, output = predicted grade.
- Model: Gradient-boosted trees with linear and random-forest baselines; cross-validated.
- Metrics: R² 0.82, MAE ~1.4 grade points (design targets for the built-to-order training run); reported per subject. No measured figures are claimed before the run.
| Parameter | Value |
|---|---|
| Records | 649 students, 33 attributes |
| Target | G3 final grade, 0–20 |
| Model R² | 0.82 (design target) |
| MAE | Approximately 1.4 grade points (design target) |
| Warning threshold | Predicted G3 < 10 → mentoring flag |
| Demo | Single-page predictor, runs offline |
Project features
- [Final-grade predictor] Enter study time, absences, past grades and background factors; get a predicted G3 (0–20) with a risk band and plain-language guidance.
- [Per-prediction explanations] The demo shows which factors pushed each prediction up or down, so a counsellor sees reasons, not a black-box number.
- [Correlation analysis] Published correlations of every attribute with G3, visualized — G1/G2 dominate, demographics trail, reported honestly.
- [Early-warning framing] Flags students predicted below the pass mark after the first period, with a documented intervention workflow for schools.
- [Grade-distribution study] The long left tail of failing students is analyzed as the target population for the warning system.
- [Regression + pass/fail modes] Both the G3 regression and a binned at-risk classifier are trained and compared in the notebook.
- [Ethics section] The report explicitly scopes the model as mentoring support and documents misuse boundaries.
What is included
- Data cleaning & exploratory-analysis notebook
- Model training & comparison notebook (GBM vs baselines)
- Interactive grade-predictor web demo
- Correlation, distribution and importance plots
- Project report PDF (background, dataset, methodology, results, ethics)
- PPT presentation for final review
- Viva Q&A preparation document (regression metrics, boosting, leakage, ethics of educational ML)
Limitations & prerequisites
- R² and MAE are design targets; the report records the actual metrics from the training run for the order.
- 649 students from two Portuguese schools — generalization to other systems needs local retraining, stated openly.
- Past grades dominate the prediction; the model cannot foresee sudden personal crises that change a student's trajectory.
- The demo's interpretable model is illustrative; the shipped notebook trains the full gradient-boosted model on the real data.
- Positioned strictly as mentoring decision support — the report forbids using it for grading, streaming or disciplinary decisions.
Frequently Asked Questions
What is the UCI Student Performance dataset?
A 2008 release by Cortez and Silva: 649 students with 33 attributes (study time, failures, absences, family background, past grades G1/G2) and the final grade G3 — the standard benchmark for educational performance modeling.
What actually predicts grades best?
Past grades (G1, G2) — correlations ~0.83–0.90. Study time, past failures and absences matter next; demographics matter least. The project reports this honestly instead of overselling exotic features.
How is "at-risk" defined?
Predicted G3 below the pass mark of 10 after the first assessment period — early enough for mentoring to change the outcome.
Why gradient boosting?
Tabular data with mixed categorical/numerical features and non-linear interactions is exactly where boosted trees beat linear models; the notebook shows the baseline comparison.
Isn't predicting student failure unethical?
Used wrongly, yes — which is why the report scopes it strictly as mentoring support with human counsellors in the loop, and documents what the model must never decide.
Is this project suitable for a final-year project?
Yes — for AI/ML, Computer Science and IT programs. It demonstrates regression modeling, honest evaluation, explainability and the ethics of applied ML. Suitable for B.E./B.Tech final-year projects in AI & Machine Learning, Computer Science and IT.
Components & software requirements
- Python 3, scikit-learn, XGBoost/LightGBM
- pandas, NumPy
- Matplotlib, Seaborn-style plots
- HTML/CSS/JavaScript predictor demo
- UCI Student Performance dataset
Dataset & model details
- Dataset: UCI Student Performance (Cortez & Silva, 2008) — 649 secondary-school students (395 mathematics, 254 Portuguese), 33 attributes covering demographics, family background, study habits and school support; target G3 on a 0–20 scale.
- Task: Regression of final grade G3 (plus binned pass/fail classification for the warning use case); input = 33 attributes, output = predicted grade.
- Model: Gradient-boosted trees with linear and random-forest baselines; cross-validated.
- Metrics: R² 0.82, MAE ~1.4 grade points (design targets for the built-to-order training run); reported per subject. No measured figures are claimed before the run.
Delivery information
Built-to-order project. Delivery timeline is shared after order confirmation based on current queue.
Support terms
Complete documentation, setup guide, and viva preparation included. Support for setup and explanation provided.