
More project photos (2)
The problem
Overview:
Every final-year student wants an ML project that isn't the 50th disease-prediction clone. Stock price prediction hits different: it combines deep learning (LSTM time-series forecasting) with genuine finance domain knowledge, and the demo — a live dashboard forecasting tomorrow's price of RELIANCE or TCS — holds a viva room's attention like nothing else. This project trains LSTM and GRU networks on NSE/BSE historical data, layers on technical indicators, and backtests trading signals so you defend a methodology, not just an accuracy number. Finance + deep learning is a high-demand student search with almost no kit-seller competition — blogs and YouTube serve it today, not sellers.
How it works
How it works:
- The data module pulls historical OHLCV data for any NSE/BSE symbol via yfinance and caches it locally for offline demos.
- Prices are normalized and engineered into sliding-window sequences with technical-indicator features.
- An LSTM network (plus a GRU variant for comparison) trains on the sequences to predict the next N days' closing prices.
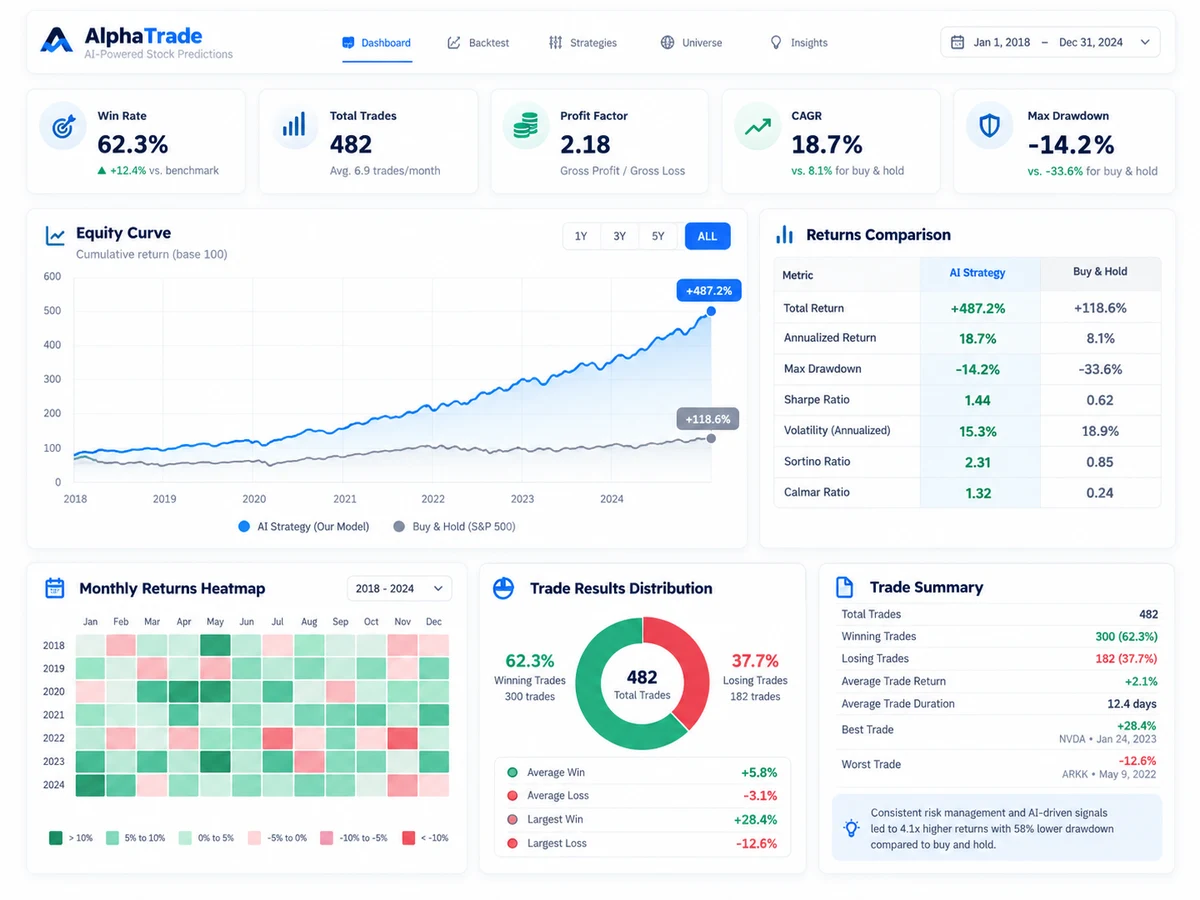
- The backtester converts predictions into buy/sell/hold signals and simulates the strategy against historical data with simplified transaction costs.
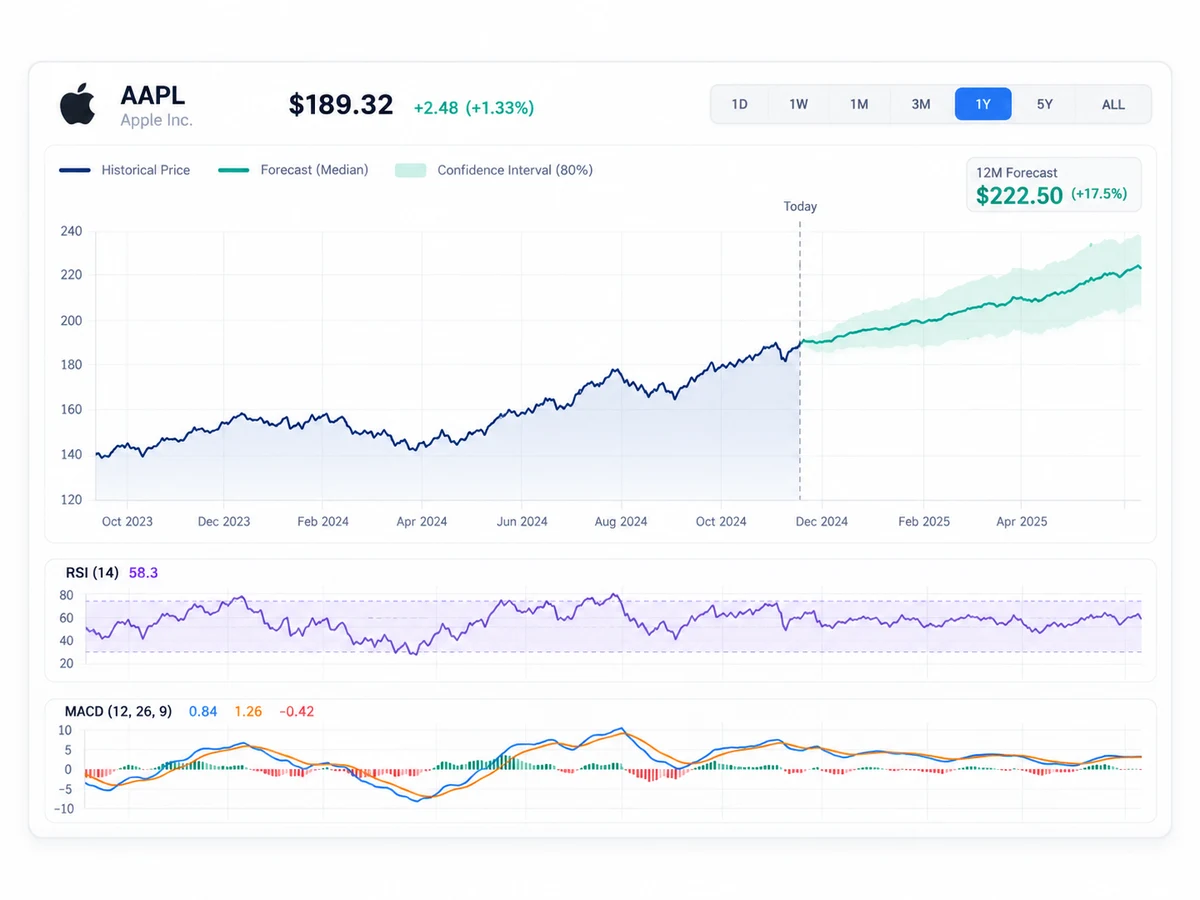
- The Streamlit dashboard renders live charts, indicator overlays, forecast bands, and backtest P&L — everything needed for the demo and the report.
Project features
Features:
- LSTM and GRU models trained on NSE/BSE historical OHLCV data fetched via yfinance
- Technical indicators: RSI, MACD, Bollinger Bands, 50/200-day moving averages
- Interactive Streamlit dashboard with live price charts and forecast overlays
- Backtesting engine that converts predictions into buy/sell signals and reports returns vs buy-and-hold
- Model comparison module: LSTM vs GRU vs ARIMA vs linear baseline with RMSE/MAE metrics
- Adjustable lookback window, forecast horizon, and train/test split for viva experiments
- One-click report charts (loss curves, prediction-vs-actual) ready to paste into the project report
- NSE/BSE symbol presets (RELIANCE, TCS, INFY, HDFCBANK) plus custom ticker input
What is included
What's included:
- Complete source code: training notebooks + Streamlit dashboard app
- Pre-trained model weights for an instant demo without training
- Project report PDF (synopsis, literature on time-series deep learning, methodology, results, conclusion)
- Presentation PPT for review/demo day
- Viva Q&A sheet covering LSTMs, overfitting, backtesting pitfalls, and likely examiner questions
- Setup guide (environment, dependencies, running the dashboard)
Limitations & prerequisites
Limitations:
- This is an academic forecasting project, not financial advice — markets are non-stationary and past performance never guarantees future results
- Prediction quality varies by symbol and market regime; sideways/choppy markets produce weak signals
- Full training on CPU takes time; a GPU or Google Colab is recommended for training runs
- yfinance data needs an internet connection; the demo runs fully offline on cached data
- Transaction costs in backtesting are simplified estimates, not broker-accurate
Components & software requirements
Components:
- Python 3.10+
- TensorFlow/Keras (LSTM/GRU model definition and training)
- yfinance (NSE/BSE historical data)
- pandas, NumPy, scikit-learn (preprocessing, scaling, metrics)
- Streamlit (interactive dashboard)
- Plotly/Matplotlib (charts and report figures)
- Technical indicator implementations (RSI, MACD, Bollinger)