
More project photos (2)
The problem
Investors, incubators and analysts all face the same hard question: which early signals separate the startups that get acquired from the ones that shut down? Human judgment here is famously noisy — famous investors miss more often than they hit — and the factors (funding rounds, team size, market timing, geography) interact in ways intuition cannot track. Machine learning treats this as tabular binary classification: learn from hundreds of historical startup outcomes which feature patterns point toward acquisition and which toward closure. This project builds that pipeline on the public Kaggle Startup Success Prediction dataset (923 startups, 49 raw attributes, with acquired-vs-closed outcomes), compares several classifiers honestly, and explains predictions through learned feature weights rather than treating the model as an oracle.
How it works
- The Startup Success Prediction dataset (923 startups, 49 attributes, acquired/closed labels) is loaded and profiled for missing values and class balance.
- Features are cleaned, encoded and scaled; funding-timeline and categorical features are engineered per the documented pipeline.
- The data is split into train/validation/test sets with stratification, because the classes are imbalanced (597 acquired, 326 closed).
- Logistic regression, random forest and gradient-boosted trees are trained with cross-validation; the best is chosen by F1 on validation data.
- The final model is evaluated on the held-out test set with accuracy, precision, recall, F1, ROC-AUC and the confusion matrix.
- The browser demo runs gradient descent live on a built-in sample dataset and serves the prediction form with per-feature explanations.
Tech stack:
- Python, scikit-learn (logistic regression, random forest, gradient boosting)
- pandas, NumPy (data cleaning, feature engineering)
- Matplotlib, seaborn (EDA plots, confusion matrix, ROC curve)
- Jupyter notebook (training, tuning and evaluation)
- Single-file HTML/CSS/JS demo app (live gradient-descent training, prediction form)
| Parameter | Value |
|---|---|
| Task | Binary classification: startup acquired vs closed |
| Dataset | Kaggle Startup Success Prediction (923 startups, 49 raw attributes; 597 acquired / 326 closed) |
| Features | ~32 engineered features: funding rounds, amounts, timing, team, geography, sector encodings |
| Models | Logistic regression, random forest, gradient-boosted trees (same splits, F1-selected) |
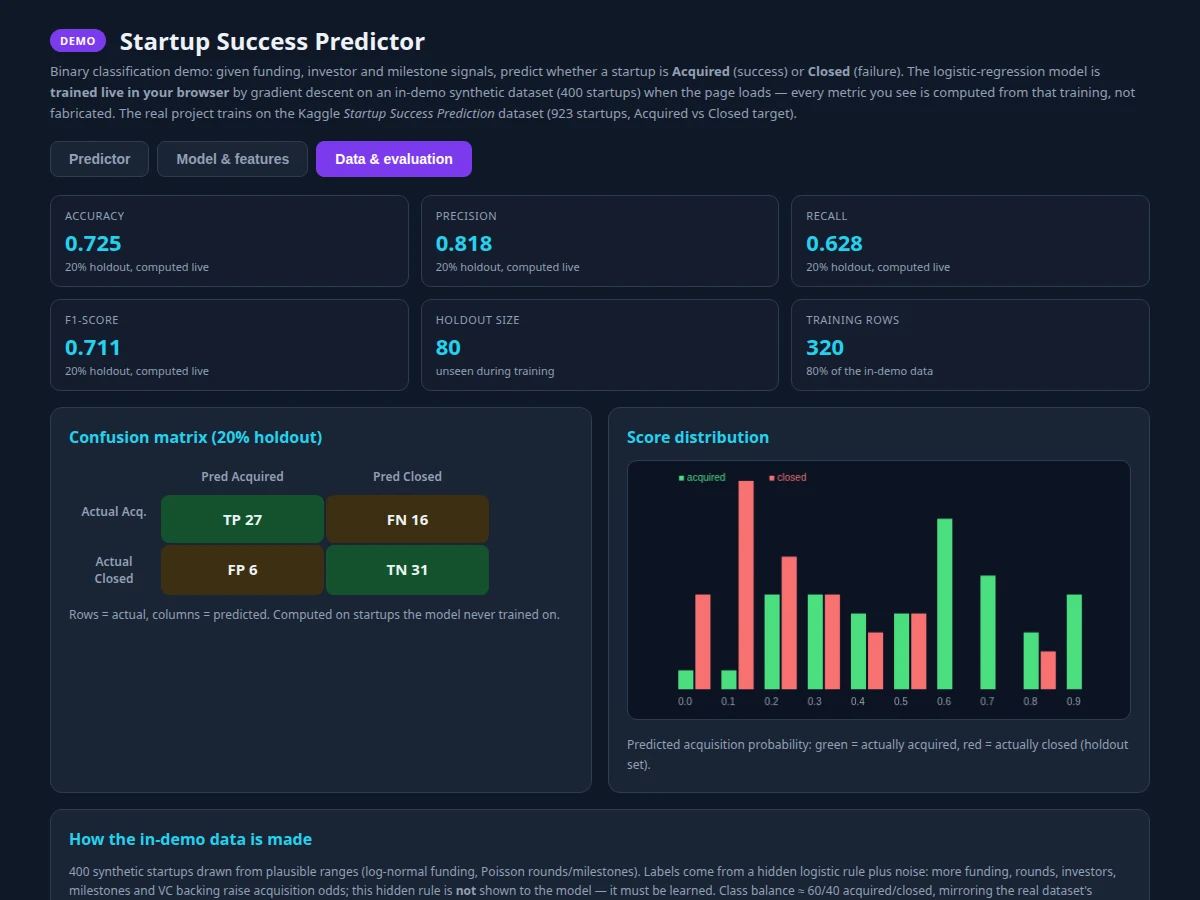
| Evaluation | Accuracy, precision, recall, F1, ROC-AUC, confusion matrix — computed on your held-out test split during the build |
| Class handling | Stratified splits; imbalance handling documented in the pipeline |
| Demo | Single HTML file; trains logistic regression live by gradient descent, serves prediction form with feature weights |
Project features
- [Feature engineering pipeline] The notebook turns the 49 raw attributes into a clean numeric feature matrix: missing-value handling, categorical encoding, scaling and derived funding-timeline features.
- [Multiple classifier comparison] Logistic regression, random forest and gradient-boosted trees are trained on the same splits and compared on identical metrics — no cherry-picking the winner.
- [Full evaluation reporting] Accuracy, precision, recall, F1, ROC-AUC and the confusion matrix are computed on a held-out test split, with class-imbalance handling (the dataset has 597 acquired vs 326 closed) documented.
- [Live browser training] The demo app trains logistic regression by gradient descent in real time on built-in data, showing the loss curve falling — the learning process itself is visible.
- [Prediction form] Enter a startup's funding and company features and get an acquisition-probability prediction with the contributing feature weights listed beside it.
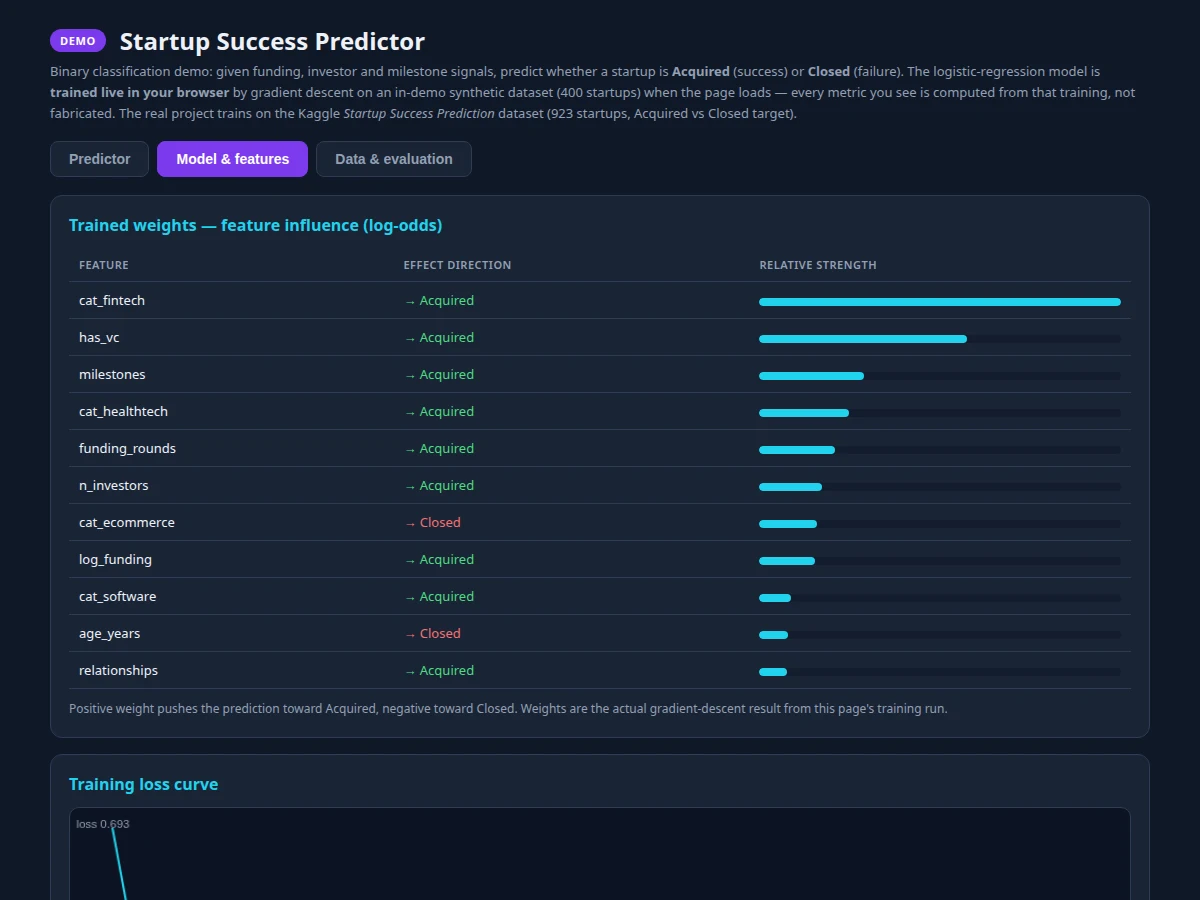
- [Weights inspection] The trained coefficient table shows which features push toward acquisition and which toward closure, giving genuine explainability for the report.
- [Data explorer] The demo's data view summarizes the feature distributions and class balance so the viva can start from the data, not from the model.
What is included
- Complete source code (data pipeline, feature engineering, training, evaluation, demo app)
- Jupyter training and evaluation notebooks (buyer-run: preprocess, train, tune, evaluate)
- Single-file browser demo app with live training and prediction form
- Project abstract PDF
- Project report (background, dataset analysis, model comparison, evaluation, error analysis)
- PPT presentation and viva Q&A document (logistic regression, class imbalance, gradient descent, evaluation metrics)
Limitations & prerequisites
- Historical correlation is not causation: the model finds patterns in past startup outcomes, and those patterns may not transfer to new markets or time periods — the report states this plainly.
- 923 startups is a modest dataset for 49 raw attributes; feature selection and regularization matter, and results vary with the train/test split.
- The public dataset reflects a specific era and geography of startups; it is not a global predictor of startup success.
- No accuracy figure is claimed ahead of your own build — every metric in the report comes from the buyer's run on their held-out split.
Frequently Asked Questions
Is this project suitable for a final-year project?
Yes — it suits Computer Science, AI/ML and Data Science programs, demonstrating data cleaning, feature engineering, classifier comparison, imbalance handling and evaluation in one build.
Which dataset is used?
The Kaggle Startup Success Prediction dataset: 923 startups, 49 raw attributes, with acquired (597) vs closed (326) outcomes.
Which model is used?
Logistic regression, random forest and gradient-boosted trees are compared on identical splits; the best is chosen by validation F1. Logistic regression's weights also give explainability.
What accuracy can I expect?
None is claimed in advance — the notebooks compute accuracy, precision, recall, F1, ROC-AUC and the confusion matrix on your held-out test split during the build.
Can the model predict a real new startup?
It produces a probability from the learned patterns, but it is a demonstration trained on historical data, not an investment tool — the report keeps this boundary explicit.
Does the demo need a server?
No. The demo is a single HTML file that trains and predicts entirely in the browser. Suitable for B.E./B.Tech final-year projects in Computer Science, AI/ML and Data Science.
Components & software requirements
- Python, scikit-learn (logistic regression, random forest, gradient boosting)
- pandas, NumPy (data cleaning, feature engineering)
- Matplotlib, seaborn (EDA plots, confusion matrix, ROC curve)
- Jupyter notebook (training, tuning and evaluation)
- Single-file HTML/CSS/JS demo app (live gradient-descent training, prediction form)
Delivery information
Built-to-order project. Delivery timeline is shared after order confirmation based on current queue.
Support terms
Complete documentation, setup guide, and viva preparation included. Support for setup and explanation provided.