
More project photos (2)
The problem
A solar farm is thousands of panels, and defects — micro-cracks from handling, hotspots from failing cells, delamination — silently cut output long before anyone notices. Manual inspection of a large installation is slow and inconsistent, and many defects are invisible to the naked eye anyway. Electroluminescence (EL) imaging solves the visibility problem: running a current through the cell makes it glow, and cracks and dead regions show up as dark patterns in the image. This project adds the classification layer on top of that imaging: a transfer-learned ResNet or EfficientNet classifies each cell image and localizes the defect with Grad-CAM so the inspector sees where to look, not just a label. Honesty matters here: the public EL datasets annotate cells with defect likelihood, not per-type defect classes, so the build is framed as functional-vs-defective classification with visual localization — an inspection aid for triage, never certified quality-control equipment.
How it works
Dataset & model:
Dataset name: Public solar-cell EL (electroluminescence) image datasets, including the ELPV-style benchmark (Deitsch et al., "Automatic Classification of Defective Photovoltaic Module Cells in Electroluminescence Images", Solar Energy, 2019).
Source: Public academic releases of solar-cell EL imagery.
Task: Binary/graded defect classification of solar cells (functional vs defective) with Grad-CAM localization.
Classes: Defect-likelihood bands — the ELPV benchmark annotates each cell with a defect probability (0.0 / 0.33 / 0.66 / 1.0) and the module type (mono/poly); the build binarizes or grades these into functional/defective. The datasets do NOT provide per-type defect classes, so "crack"/"hotspot" naming in inspector-facing text is qualitative, supported by Grad-CAM localization and the report's error analysis, not by dataset labels.
Model: Transfer-learned CNN — pre-trained ResNet or EfficientNet backbone fine-tuned on the EL images.
Input: Solar-cell EL images (grayscale), contrast-enhanced, cropped and normalized.
Prediction: Defect-likelihood probability per cell image.
Output: Functional/defective verdict with probability score, Grad-CAM localization overlay, and batch-mode panel-level summaries.
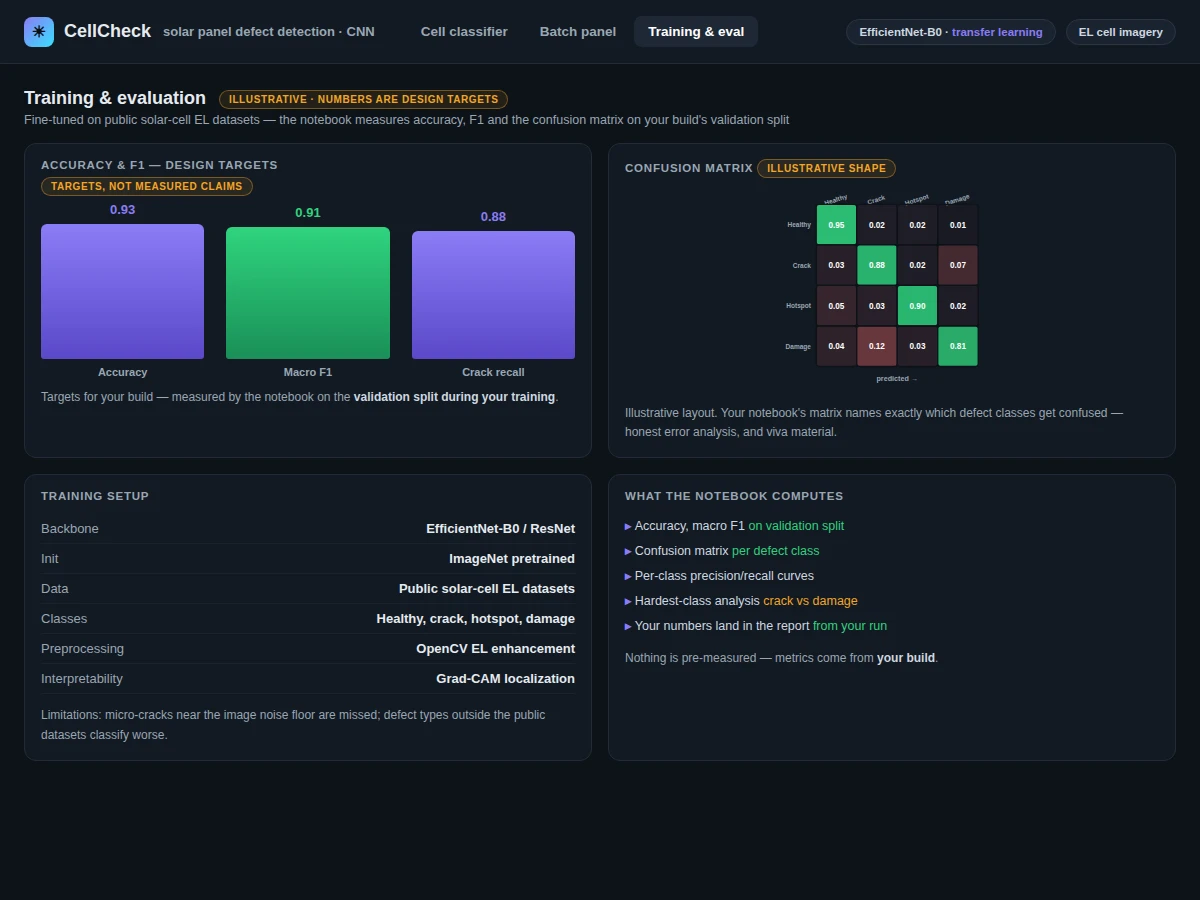
Evaluation metrics: Accuracy, F1 and confusion matrix on the validation split — computed by the Jupyter notebook during the buyer's build. No metrics claimed; design target approximately 85%+ validation accuracy.
Working:
- EL cell images are loaded, contrast-enhanced with OpenCV, then cropped and normalized to the classifier's input size.
- Training phase: a pre-trained ResNet or EfficientNet is fine-tuned on the EL datasets for functional/defective classification.
- Inference phase: the fine-tuned network predicts the defect likelihood for each cell image with a probability score.
- Grad-CAM overlays highlight the regions that drove each defect prediction, giving the inspector a localization map.
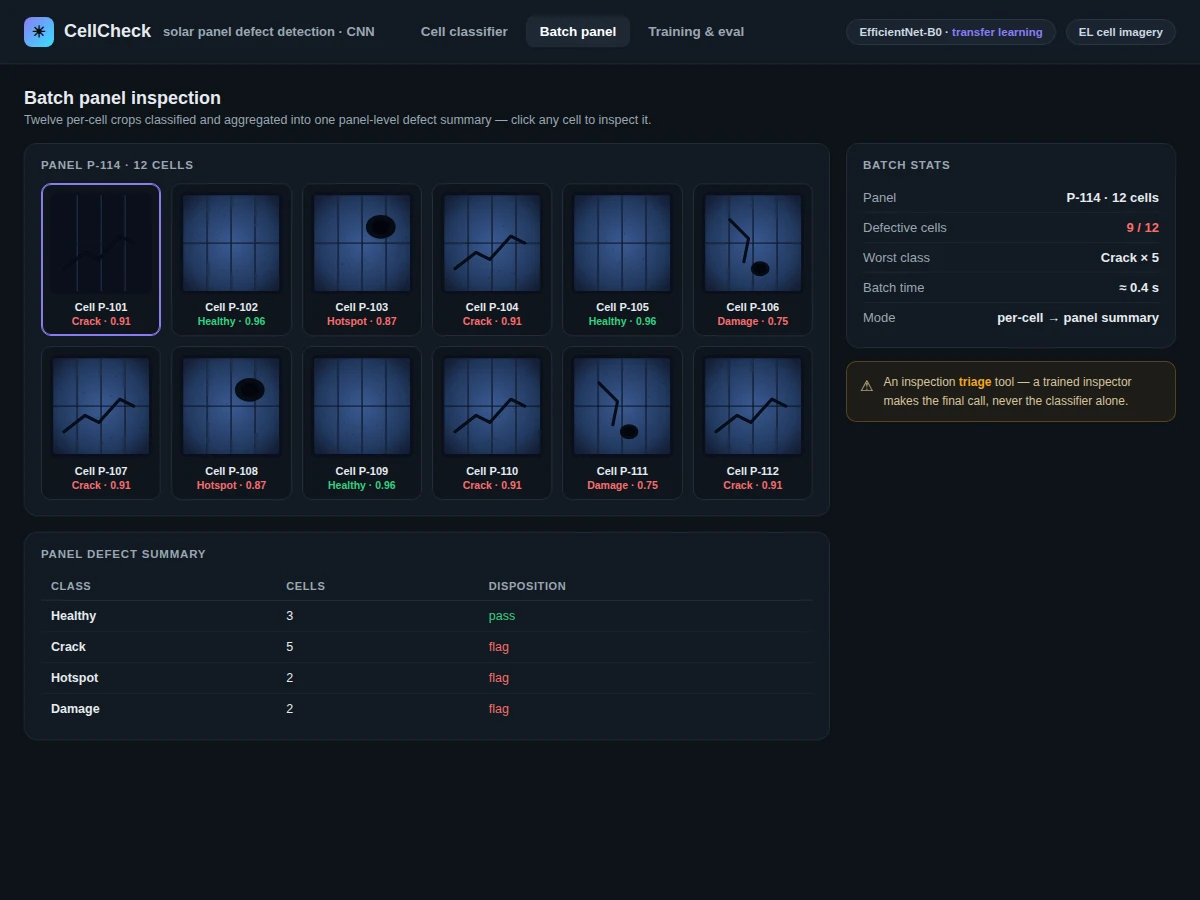
- Batch mode aggregates per-cell results into panel-level defect summaries.
- Evaluation phase: the notebook computes accuracy, F1 and the confusion matrix on the validation split; the confusion matrix names the confused probability bands explicitly. The demo app serves predictions with overlays for uploaded cell images.
Specifications:
Model | Transfer-learned CNN (ResNet or EfficientNet backbone, ImageNet pre-trained, fine-tuned)
Data | Public solar-cell electroluminescence (EL) image datasets (EL imaging only)
Task | Functional/defective classification of solar cells with Grad-CAM localization
Input | EL cell images (grayscale), contrast-enhanced and normalized
Output | Defect-likelihood score + Grad-CAM overlay per cell; panel-level summaries in batch mode
Evaluation | Accuracy, F1, confusion matrix on the validation split — computed by the notebook during the buyer's build
Design target | Approximately 85%+ validation accuracy (target, not a measured claim)
Demo app | Flask app with cell-image upload and overlay display
Scope | Defect-likelihood bands labeled in the public EL datasets
Project features
[EL Defect Classifier] (implemented) — Transfer-learned ResNet/EfficientNet classifying solar-cell EL images as functional or defective with a probability score.
[EL Enhancement Pipeline] (implemented) — Contrast enhancement and cell cropping normalize EL imagery before classification.
[Grad-CAM Defect Localization] (implemented) — Overlays highlight the regions driving each defect prediction so the inspector sees where to look.
[Batch Panel-Inspection Mode] (implemented) — Aggregates per-cell results into panel-level defect summaries for whole-panel triage.
[Evaluation Notebook] (implemented) — Computes accuracy, F1 and the confusion matrix on the validation split with validation plots during the build.
[Cell-Image Demo App] (implemented) — Flask app serves predictions with Grad-CAM overlays for uploaded cell images.
[Drone-Based Panel Imaging] (future-scope) — Drone capture and instance segmentation for defect sizing are future work, not included features.
What is included
Complete source code (training, inference, batch mode, Grad-CAM, demo app)
Jupyter training and evaluation notebook (accuracy, F1, confusion matrix, validation plots)
Project report PDF (background, EL imaging, methodology, evaluation, error analysis)
PPT presentation for final review
Viva Q&A preparation document (CNNs, transfer learning, EL imaging, Grad-CAM, evaluation)
Setup guide (environment, dataset download, training, running on your own cell images)
Limitations & prerequisites
Public EL datasets are the only evaluated source: defect types, cell technologies and imaging setups outside them classify worse, and the report documents this coverage gap openly.
Subtle micro-cracks near the image noise floor are missed; the confusion matrix in the notebook quantifies exactly which defect-likelihood bands are hardest.
The datasets annotate defect likelihood, not defect-type classes — defect-type naming is qualitative, supported by Grad-CAM and the error analysis.
This is an educational inspection prototype, not a certified quality-control system — it must not be the sole basis for warranty or safety decisions on real installations.
EL imaging requires the cell to be energized with current; the project assumes EL images as input and does not include EL capture hardware.
Frequently Asked Questions
Which dataset and model are used?
Public solar-cell EL (electroluminescence) image datasets, including the standard ELPV-style benchmark of 300x300 grayscale cell images (Deitsch et al., 2019). The model is a ResNet or EfficientNet CNN, pre-trained on ImageNet and fine-tuned on the EL images (transfer learning).
What defect types does it detect?
The datasets annotate cells with defect likelihood (functional vs defective), not per-type classes like "crack" or "hotspot". The classifier outputs functional/defective with a probability score, and Grad-CAM overlays localize where the defect pattern appears so the inspector can judge the defect type visually.
Is the performance guaranteed?
No measured performance is claimed. The included notebook computes accuracy, F1 and the confusion matrix on the validation split during the buyer's build; the design target is approximately 85%+ validation accuracy.
Can this certify panels for warranty or safety?
No. This is an educational inspection prototype, not certified quality-control equipment. It must not be the sole basis for warranty or safety decisions on real installations.
Is this project suitable for a final-year project?
Yes, for B.E./B.Tech in Computer Science, AI/ML, Data Science, Electrical and related programs. It demonstrates transfer learning, EL imaging, Grad-CAM interpretability and confusion-matrix error analysis.
What will I receive, and can it be customized?
Source code (training, inference, batch mode, Grad-CAM, demo app), the evaluation notebook, report, PPT, viva Q&A and a setup guide. Customizable: drone-based panel imaging, instance segmentation for defect sizing, multi-modal EL plus thermal fusion, scoped at quotation.
Components & software requirements
Python 3.10, PyTorch (CNN training and inference)
torchvision (pre-trained ResNet and EfficientNet backbones)
OpenCV (EL image enhancement, defect overlays)
NumPy, scikit-learn (metrics, confusion matrix)
Jupyter Notebook (evaluation with accuracy and F1)
Flask (demo app with cell-image upload interface)
Public solar-cell EL image datasets (download guidance in the setup guide)
GPU recommended for fine-tuning (cloud-GPU guidance in the setup guide)
Delivery information
Built-to-order: the source code, evaluation notebook, report, PPT and viva kit are prepared fresh for the buyer. Typical delivery spans dataset setup, the fine-tuning run, evaluation and documentation; the exact schedule is confirmed at quotation.
Support terms
Setup guidance (environment, dataset download, training commands, running on your own cell images); viva preparation covering CNNs, transfer learning, EL imaging, Grad-CAM and evaluation; customization discussion (drone imaging, defect sizing, EL plus thermal fusion) scoped at quotation.