
More project photos (2)
The problem
Salary benchmarking matters to students choosing careers, HR teams framing offers and analysts studying labor markets — yet most regression teaching stops at textbook equations with toy numbers that never touch a real dataset. This project makes regression concrete end to end: it takes a genuine public dataset of employee experience and salary figures, walks through exploratory analysis, fits four real regressors, and compares them with proper train/test evaluation instead of declaring a winner by gut feel. Because the relationship between experience and pay is intuitive, every modeling decision — why a straight line underfits at the extremes, what a polynomial term buys, when a forest overfits 30 rows — is visible in the plots and directly discussable in the viva. It is the rare ML project where the mathematics, the data and the evaluation all fit one coherent story.
How it works
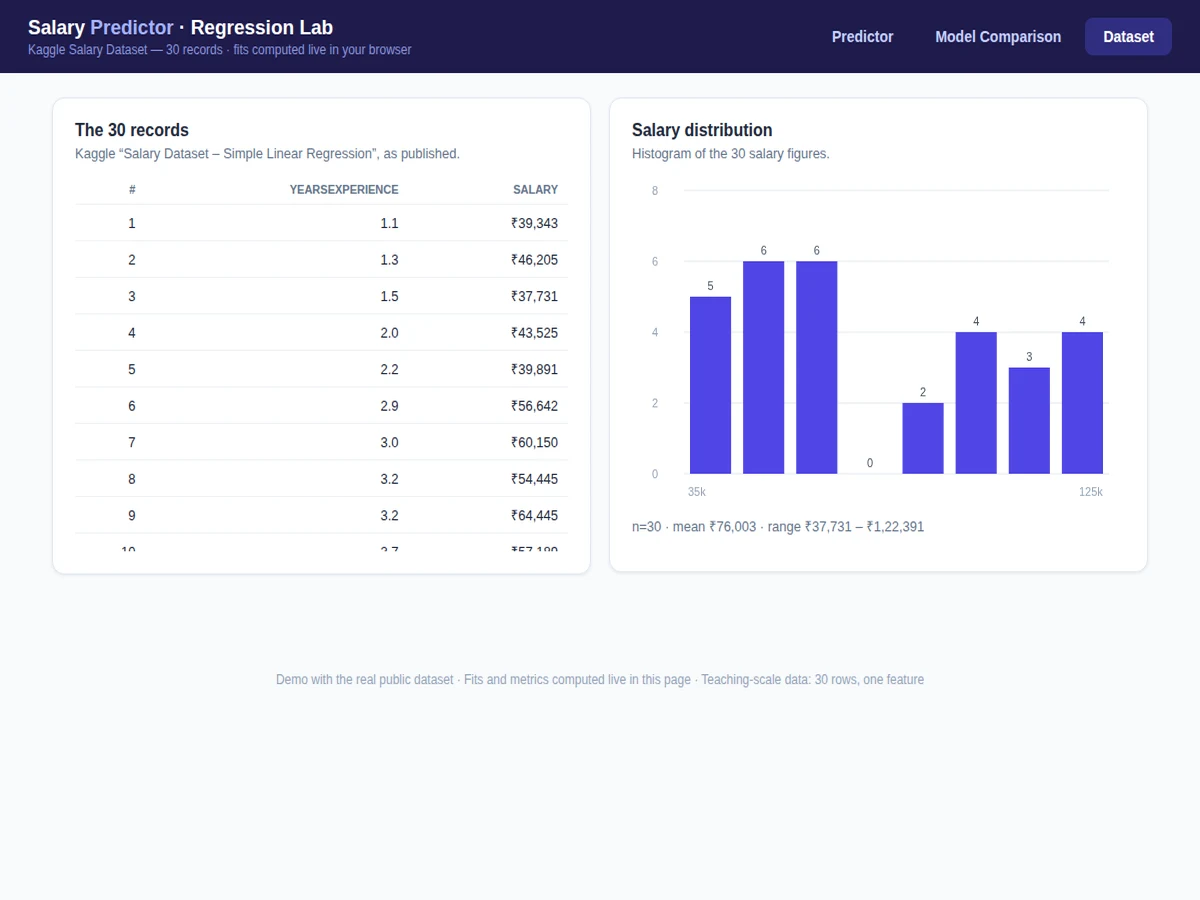
- The Kaggle Salary Dataset CSV (30 rows: YearsExperience, Salary) is loaded, checked for missing values and profiled with descriptive statistics.
- Exploratory analysis plots the experience–salary scatter, salary distribution and correlation, and flags any outlier records before modeling.
- Features and target are separated and split 80/20 into train and test sets with a fixed random seed so results reproduce exactly.
- Four regressors — Linear, Ridge, Polynomial (degree 2) and Random Forest — are trained on the training split; hyperparameters (Ridge alpha, forest depth) are chosen by cross-validation on the training data only.
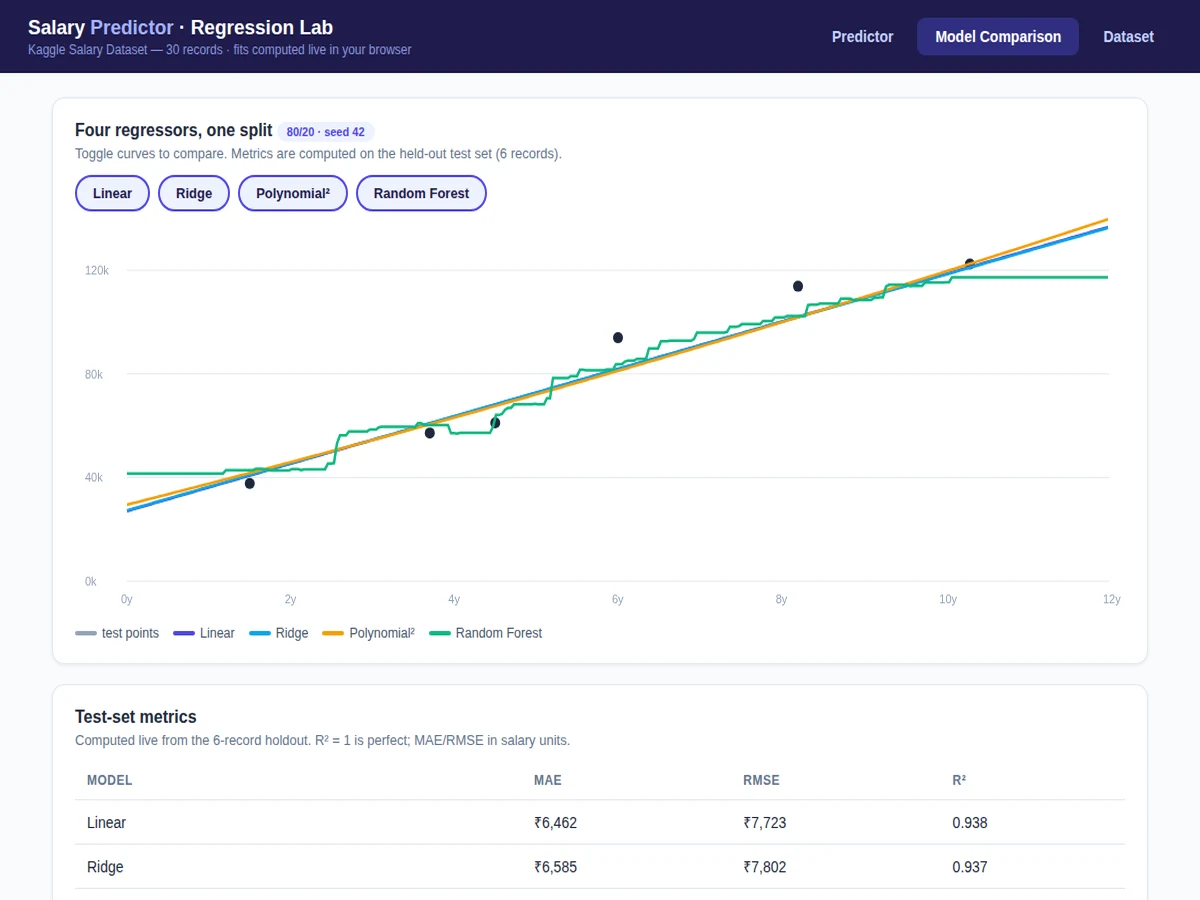
- Each model predicts the held-out test set and is scored with MAE, RMSE and R²; residual plots reveal systematic errors such as under-prediction at high experience.
- The demo app loads the trained models, accepts a years-of-experience input, and returns the predicted salary with the model's test metrics and the regression curve for context.
Tech stack:
- Python 3.10, pandas and NumPy for data handling
- scikit-learn (LinearRegression, Ridge, PolynomialFeatures, RandomForestRegressor, metrics)
- Matplotlib and Seaborn for EDA and regression plots
- Jupyter notebook for the buyer-run analysis and training
- Flask demo app with prediction form and regression visualization
- Kaggle Salary Dataset – Simple Linear Regression (30 records, public)
| Parameter | Value |
|---|---|
| Dataset | Kaggle "Salary Dataset – Simple Linear Regression": 30 rows, columns YearsExperience and Salary (public, cited in report) |
| Task | Univariate regression: predict Salary from YearsExperience |
| Models | Linear Regression, Ridge, Polynomial (degree 2), Random Forest — same split, same metrics |
| Split | 80/20 train/test, fixed random_state=42, reproducible |
| Metrics | MAE, RMSE, R² on held-out test set — computed by the notebook during your build |
| Demo | Flask app: experience input, predicted salary, fitted curve, per-model metrics |
| Reproducibility | Fixed seeds and pinned requirements; notebook reruns to identical metrics |
Project features
- [Real public dataset] The Kaggle "Salary Dataset – Simple Linear Regression" (30 employee records with YearsExperience and Salary columns) is used as-is, with the dataset page cited in the report — no fabricated rows, no invented salary figures.
- [Four-model comparison] Linear Regression, Ridge, second-degree Polynomial and Random Forest regressors are trained on the same train/test split and ranked on identical metrics, so the comparison is fair and reproducible.
- [Proper evaluation protocol] A fixed 80/20 train/test split (random_state=42) with MAE, RMSE and R² on the held-out test set, plus residual plots that show where each model systematically over- or under-predicts.
- [Exploratory analysis] The notebook covers distributions, the experience–salary scatter, correlation, and outlier inspection before any model is fit — the EDA section examiners expect.
- [Interactive prediction demo] A web app takes years of experience and returns the predicted salary from the selected model, with the fitted regression line drawn over the data scatter and per-model test metrics displayed.
- [Regularization made visible] Ridge's penalty term and the polynomial's curvature are plotted against the plain linear fit, turning abstract bias–variance discussion into something the student can point at.
- [Reproducible notebook] Fixed random seeds, pinned library versions and a requirements file mean the buyer reruns the notebook and gets the same metrics the report quotes.
What is included
- Complete source code (data loading, EDA, four-model training, evaluation, demo app)
- Jupyter analysis and training notebook (buyer-run: rerun on the dataset, reproduce every metric and plot)
- The public dataset CSV with its Kaggle source cited
- Project report PDF (background, EDA, methodology per model, evaluation tables, residual analysis, limitations)
- PPT presentation for final review
- Viva Q&A preparation document (OLS, regularization, bias–variance, R² vs RMSE, overfitting on small data)
- Setup guide (environment, running the notebook, using the demo app)
Limitations & prerequisites
- The dataset has only 30 records and a single feature: it is a teaching-scale dataset, and the report says so plainly — models trained on it demonstrate methodology, not labor-market truth.
- Salary depends on role, industry, location, skills and negotiation, none of which are in this dataset; the model must not be presented as career or compensation advice.
- With 30 rows, flexible models (polynomial, random forest) can overfit the training split; the report uses the test-set metrics and residual plots to discuss this openly rather than hiding it.
- No performance number is pre-claimed: MAE, RMSE and R² are computed by the notebook on the held-out test set during your build, and the report presents them with the fixed-seed protocol that reproduces them.
- Results describe the dataset's population only; applying the fitted line to a different country, industry or decade is extrapolation the report explicitly warns against.
Frequently Asked Questions
Is this project suitable for a final-year project?
Yes — it fits Computer Science, AI/ML and Data Science programs and gives examiners a clean, complete regression story: real data, EDA, four models, honest evaluation and an interactive demo, all discussable in depth at viva.
Which dataset is used?
The public Kaggle "Salary Dataset – Simple Linear Regression" — 30 employee records with YearsExperience and Salary columns — used as published and cited in the report. No rows are fabricated or altered.
Which models are compared?
Linear Regression, Ridge, second-degree Polynomial and Random Forest, all trained on the same 80/20 split (fixed seed) and ranked on MAE, RMSE and R² computed on the held-out test set.
How accurate is the prediction?
The notebook computes MAE, RMSE and R² on the test set during your build — those are the numbers the report quotes, reproducible via the fixed random seed. With 30 rows and one feature, treat it as a methodology demonstration, not a compensation oracle.
Can more features be added?
The base project is univariate on the published dataset. A multi-feature variant (role, education, location) is possible as an optional customization with a richer dataset, but it is not part of the base build.
What will I receive with the project?
Full source code and the analysis notebook, the dataset CSV, project report PDF, PPT, viva Q&A document and the setup guide. Suitable for B.E./B.Tech final-year projects in Computer Science, AI/ML and Data Science.
Components & software requirements
- Python 3.10, pandas and NumPy for data handling
- scikit-learn (LinearRegression, Ridge, PolynomialFeatures, RandomForestRegressor, metrics)
- Matplotlib and Seaborn for EDA and regression plots
- Jupyter notebook for the buyer-run analysis and training
- Flask demo app with prediction form and regression visualization
- Kaggle Salary Dataset – Simple Linear Regression (30 records, public)
Delivery information
Built-to-order project. Delivery timeline is shared after order confirmation based on current queue.
Support terms
Complete documentation, setup guide, and viva preparation included. Support for setup and explanation provided.