
More project photos (2)
The problem
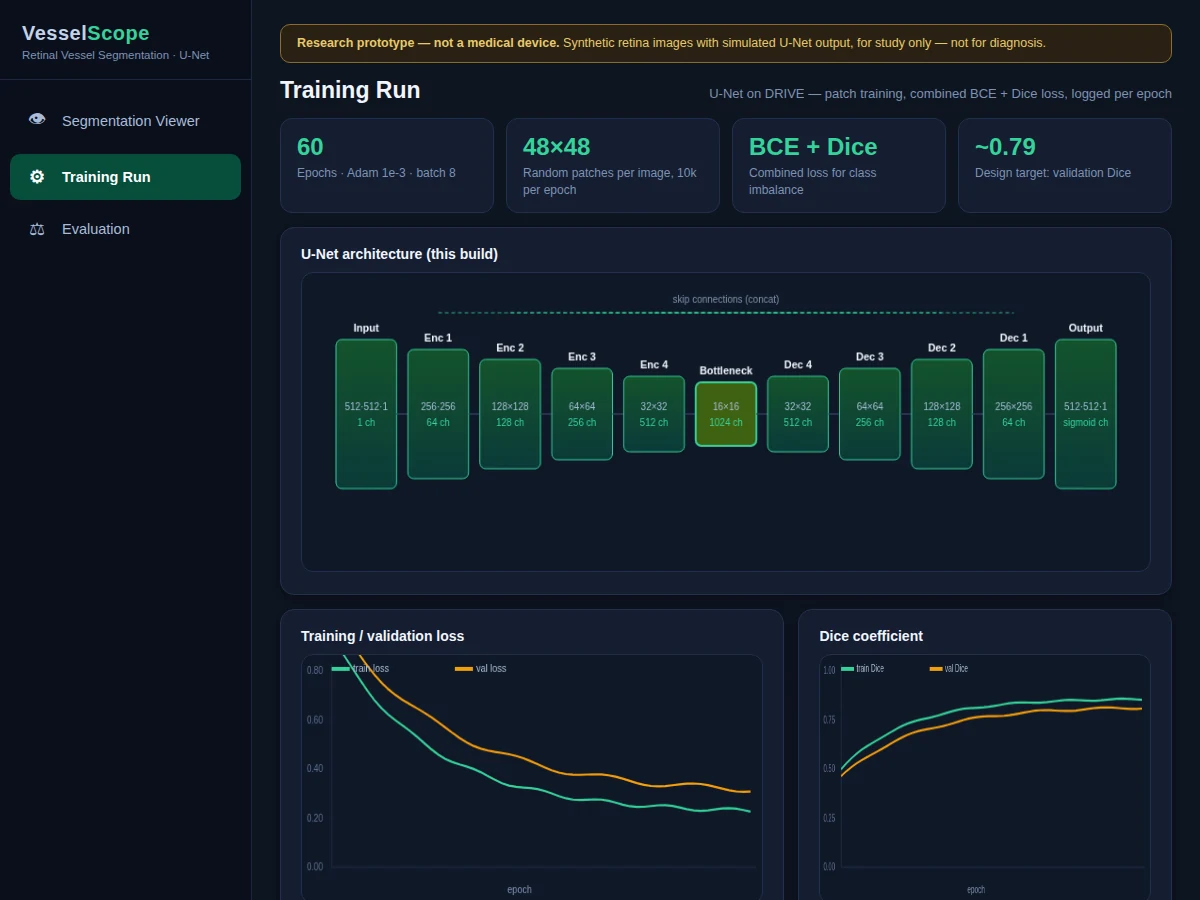
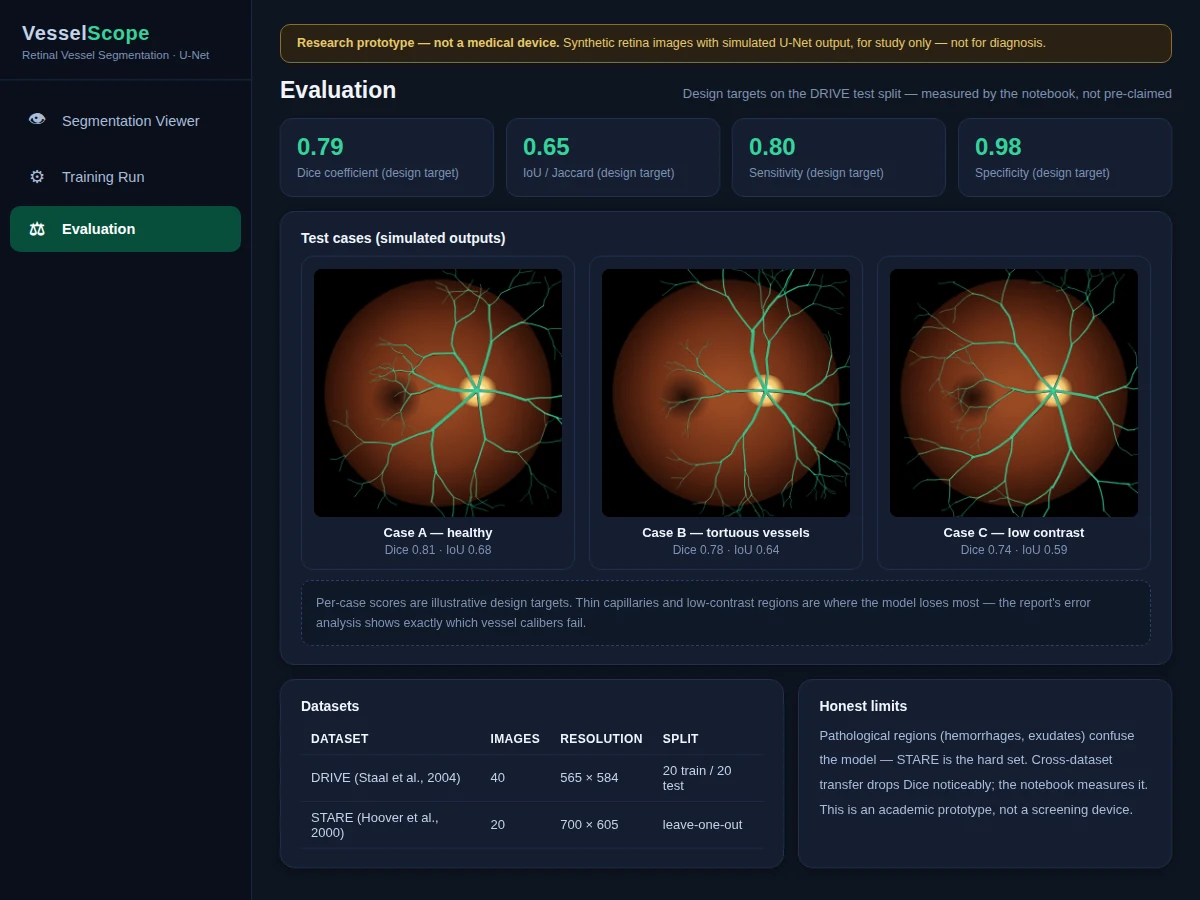
The retinal vessel tree is one of the few places vasculature can be photographed directly, and its shape carries early signatures of diabetic retinopathy, glaucoma and hypertension. Tracing those vessels by hand — the gold standard for training data — takes an expert close to two hours per image, which is why automated segmentation matters. The DRIVE dataset (40 fundus images with expert vessel tracings, Staal et al., 2004) is the field's standard benchmark, and U-Net (Ronneberger et al., 2015) remains the reference approach: an encoder-decoder whose skip connections preserve the fine detail thin capillaries demand. This project implements that pipeline: green-channel extraction, CLAHE, patch-based training on the 20 training images, a BCE+Dice loss for the 10:1 class imbalance, and evaluation with Dice, IoU, sensitivity and specificity. A viewer makes outputs inspectable: probability maps, threshold slider, overlays and ground-truth comparisons, with an honest error analysis of missed vessel calibers.
How it works
- DRIVE fundus images (565x584) are preprocessed: green channel extracted, CLAHE applied, field-of-view mask computed.
- 48x48 patches are sampled from the 20 training images with augmentation (rotations, flips, elastic deformation, gamma jitter).
- A U-Net (encoder-decoder with skip connections) is trained with a combined binary-cross-entropy + Dice loss under the Adam optimizer for ~60 epochs.
- Dice coefficient, IoU, sensitivity and specificity are logged per epoch on a validation split; the best checkpoint is kept.
- The trained model segments the 20 DRIVE test images patch-wise; predictions are stitched, thresholded at 0.5 and evaluated against the expert manual tracings.
- The viewer application loads test images and predictions, rendering probability maps, threshold-controlled overlays and ground-truth comparisons.
Tech stack:
- Python 3.10, PyTorch (U-Net, training loop, patch inference)
- OpenCV (green channel, CLAHE, mask handling)
- NumPy (patch extraction, metric computation)
- Matplotlib (training curves, prediction visualizations)
- Jupyter notebook (buyer-run training and evaluation)
- HTML/CSS/JS viewer (probability maps, threshold slider, overlays)
| Parameter | Value |
|---|---|
| Dataset | DRIVE: 40 fundus images 565x584, 20 train / 20 test, expert manual segmentations |
| Cross-dataset | STARE: 20 images 700x605, leave-one-out evaluation |
| Model | U-Net (encoder-decoder with skip connections), single-channel input |
| Design target | ~0.79 Dice on the DRIVE test split; final numbers measured by the notebook on your build |
| Evaluation | Dice, IoU, sensitivity, specificity, ROC-AUC — per epoch and on test |
| Training | 60 epochs, Adam 1e-3, 48x48 patches, BCE+Dice loss |
| Preprocessing | Green channel + CLAHE + augmentation (rotation, flip, elastic, gamma) |
| Output | Binary vessel mask, probability map, overlay visualizations |
Project features
- [U-Net implementation] Encoder-decoder with skip connections in PyTorch, built for single-channel fundus input and binary vessel output
- [Patch-based training] 48x48 random patches (10k per epoch) so 20 DRIVE training images become a viable training set
- [Combined BCE+Dice loss] Handles the ~10:1 background-to-vessel pixel imbalance that plain cross-entropy mishandles
- [Documented preprocessing] Green-channel extraction plus CLAHE contrast enhancement — the standard, cited DRIVE preprocessing recipe
- [Full segmentation metrics] Dice coefficient, IoU, sensitivity, specificity and ROC-AUC logged per epoch and computed on the 20-image test split
- [Segmentation viewer] Probability map, live threshold slider, vessel overlay and ground-truth-vs-prediction comparison on test images
- [Augmentation pipeline] Rotations, flips, elastic deformation and gamma jitter to stretch the small training set
- [Cross-dataset check] STARE evaluation measuring how the DRIVE-trained model transfers — the honest generalization test
What is included
- Complete source code (U-Net, data pipeline, training, patch inference, evaluation, viewer)
- Jupyter training and evaluation notebook (buyer-run: trains on your GPU/CPU and logs all metrics)
- Project report PDF (background, U-Net architecture, methodology, results, error analysis)
- PPT presentation for final review
- Viva Q&A preparation document (U-Net, Dice loss, patch training, segmentation metrics, DRIVE/STARE)
- Setup guide (environment, dataset download, training, running the viewer)
Limitations & prerequisites
- This is an academic research prototype, not a medical device: it must not be used for diagnosis, screening or clinical decisions, and the viewer carries that disclaimer visibly.
- Twenty training images is a tiny dataset — augmentation and patch training stretch it, but the model memorizes DRIVE's imaging conditions and transfers worse to STARE; the notebook measures that drop openly.
- Thin capillaries and low-contrast vessel segments are where most errors concentrate; the report's error analysis breaks misses down by vessel caliber.
- Pathological regions (hemorrhages, exudates) confuse the model because DRIVE contains few of them — STARE is the harder, more honest test set.
- Training a U-Net needs a GPU for reasonable turnaround; CPU training works but is slow, and the setup guide gives realistic time estimates.
- The browser viewer renders synthetic retina-style images with a simulated model output; real DRIVE inference runs in the notebook.
Frequently Asked Questions
Which datasets are used?
DRIVE (Staal et al., 2004): 40 color fundus photographs at 565x584 with expert manual vessel segmentations, split 20/20 for train/test. STARE (Hoover et al., 2000): 20 images at 700x605 used for cross-dataset generalization checks.
Why U-Net and not a newer architecture?
U-Net is the reference architecture for this exact benchmark — its skip connections preserve the fine spatial detail that thin vessels need, and two decades of DRIVE literature give the student a solid baseline to compare against. The report discusses newer variants as future scope.
Is the Dice score guaranteed?
No. The design target is around 0.79 Dice on the DRIVE test split, but the report documents whatever the notebook measures on your build — training curves, final metrics and the STARE transfer result included.
Can it segment vessels in my own eye photos?
Not reliably. The model is trained on DRIVE's specific camera, resolution and field of view; phone photos or other cameras shift the distribution and the report documents this limitation explicitly.
Is this a medical diagnosis tool?
No. It is an educational computer-vision prototype on public research data and must not be used for diagnosis or clinical decisions.
What will I receive with the project?
Complete source code, the training and evaluation notebook, the segmentation viewer, project report PDF, PPT presentation, viva Q&A document and a setup guide. Suitable for B.E./B.Tech final-year projects in Computer Science, AI/ML and Biomedical Engineering.
Components & software requirements
- Python 3.10, PyTorch (U-Net, training loop, patch inference)
- OpenCV (green channel, CLAHE, mask handling)
- NumPy (patch extraction, metric computation)
- Matplotlib (training curves, prediction visualizations)
- Jupyter notebook (buyer-run training and evaluation)
- HTML/CSS/JS viewer (probability maps, threshold slider, overlays)
Delivery information
Built-to-order project. Delivery timeline is shared after order confirmation based on current queue.
Support terms
Complete documentation, setup guide, and viva preparation included. Support for setup and explanation provided.