
More project photos (2)
The problem
Teachers, editors and content teams share one practical problem: is this text too hard for its audience? A school textbook, a patient leaflet or a government form that overshoots its readers fails at its job, but "too hard" is subjective — until you measure it. Readability formulas turn text into numbers: sentence length, word length and syllable counts combine into grade-level scores that have been validated against comprehension tests for decades. Modern NLP goes one step further, training classifiers on corpora labeled by reading level. This project builds both: six classic formulas computed from real linguistic analysis, plus a readability-level classifier, all demonstrated in a browser app that analyzes any pasted text live and shows exactly how each score was derived.
How it works
- Pasted text is tokenized into sentences and words; a rule-based counter measures syllables, characters and polysyllabic words.
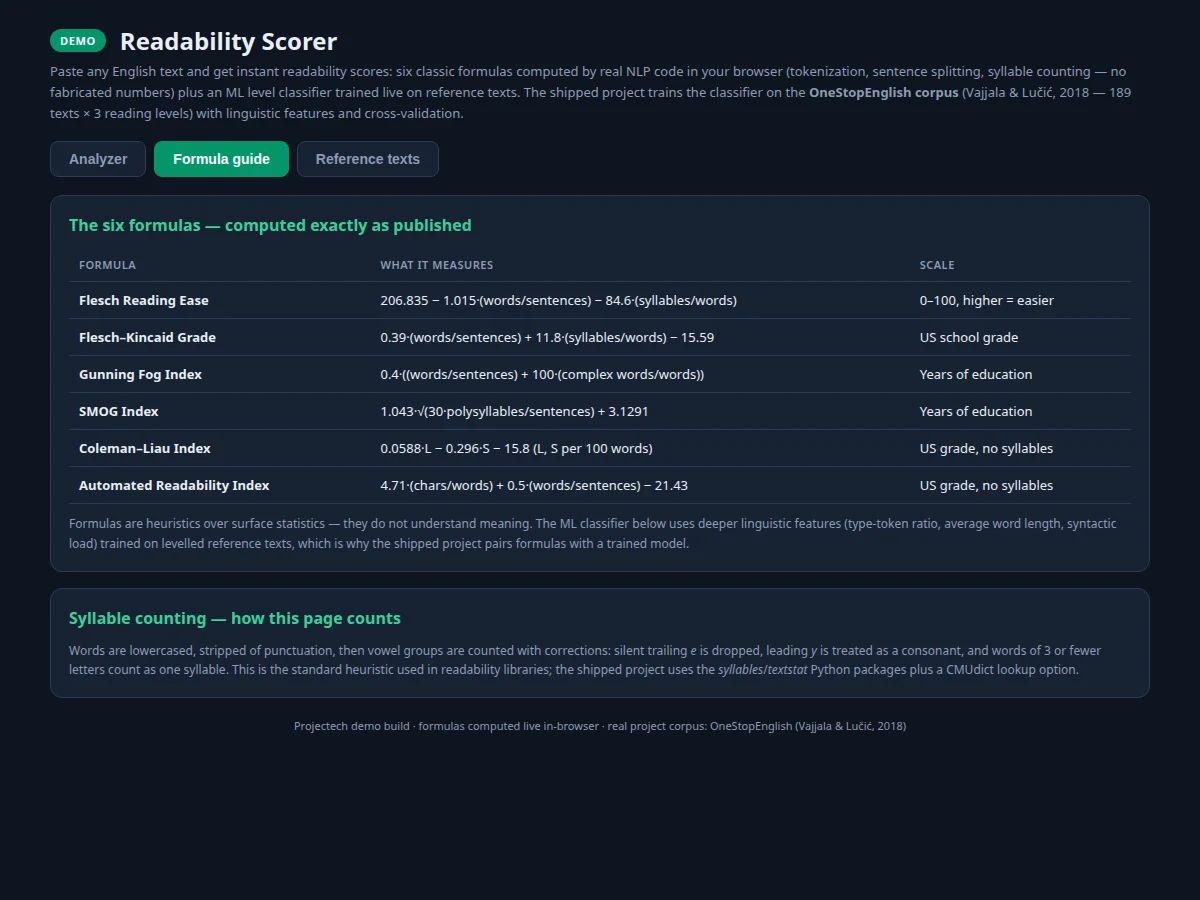
- The six formulas are computed from these counts (e.g. Flesch Reading Ease = 206.835 − 1.015·(words/sentences) − 84.6·(syllables/words)).
- The same linguistic feature vector feeds a softmax classifier trained on reference texts labeled Elementary, Intermediate or Advanced.
- The demo displays all scores with interpretation bands (e.g. Flesch 60–70 ≈ plain English) and the classifier's level prediction with confidences.
- Sentences exceeding complexity thresholds are highlighted in the source text.
- The notebook documents the formulas, the classifier training and the evaluation on reference texts.
Tech stack:
- Python (text processing, formula implementations)
- NLTK / regex tokenization (sentence and word splitting)
- NumPy, scikit-learn (softmax classifier training and evaluation)
- Matplotlib (score distributions, classifier evaluation plots)
- Jupyter notebook (formula walkthrough and classifier training)
- Single-file HTML/CSS/JS demo app (live analysis, metric dashboard)
| Parameter | Value |
|---|---|
| Formulas | Flesch Reading Ease, Flesch-Kincaid Grade Level, Gunning Fog Index, SMOG Index, Coleman-Liau Index, Automated Readability Index |
| Linguistic counts | Words, sentences, syllables, characters, polysyllabic words — measured by the pipeline |
| Classifier | Softmax classifier on linguistic features; levels: Elementary / Intermediate / Advanced |
| Reference data | OneStopEnglish corpus (Vajjala & Lucic, 2018): 189 texts × 3 levels; WeeBit (625 articles × 5 age classes) discussed as extension |
| Input | Any pasted or uploaded plain text |
| Output | Six formula scores with interpretations, predicted reading level with confidences, flagged complex sentences |
| Evaluation | Classifier accuracy and confusion matrix on held-out reference texts — computed during your build |
| Demo | Single HTML file; all analysis runs client-side, no server needed |
Project features
- [Six readability formulas] Flesch Reading Ease, Flesch-Kincaid Grade Level, Gunning Fog, SMOG, Coleman-Liau Index and ARI — each computed from measured linguistic counts, not approximations.
- [Real syllable counting] A rule-based syllable counter handles silent-e, diphthongs and edge cases so formula inputs are genuine measurements.
- [Level classifier] A softmax classifier trained on reference texts assigns Elementary, Intermediate or Advanced reading level, with per-class confidence shown.
- [Live text analysis] Paste any text and the demo tokenizes it, counts sentences, words, syllables and polysyllabic words, then reports all six scores instantly.
- [Metric explanations] Every score ships with its formula, its interpretation scale and what drives it up or down — the report practically writes itself.
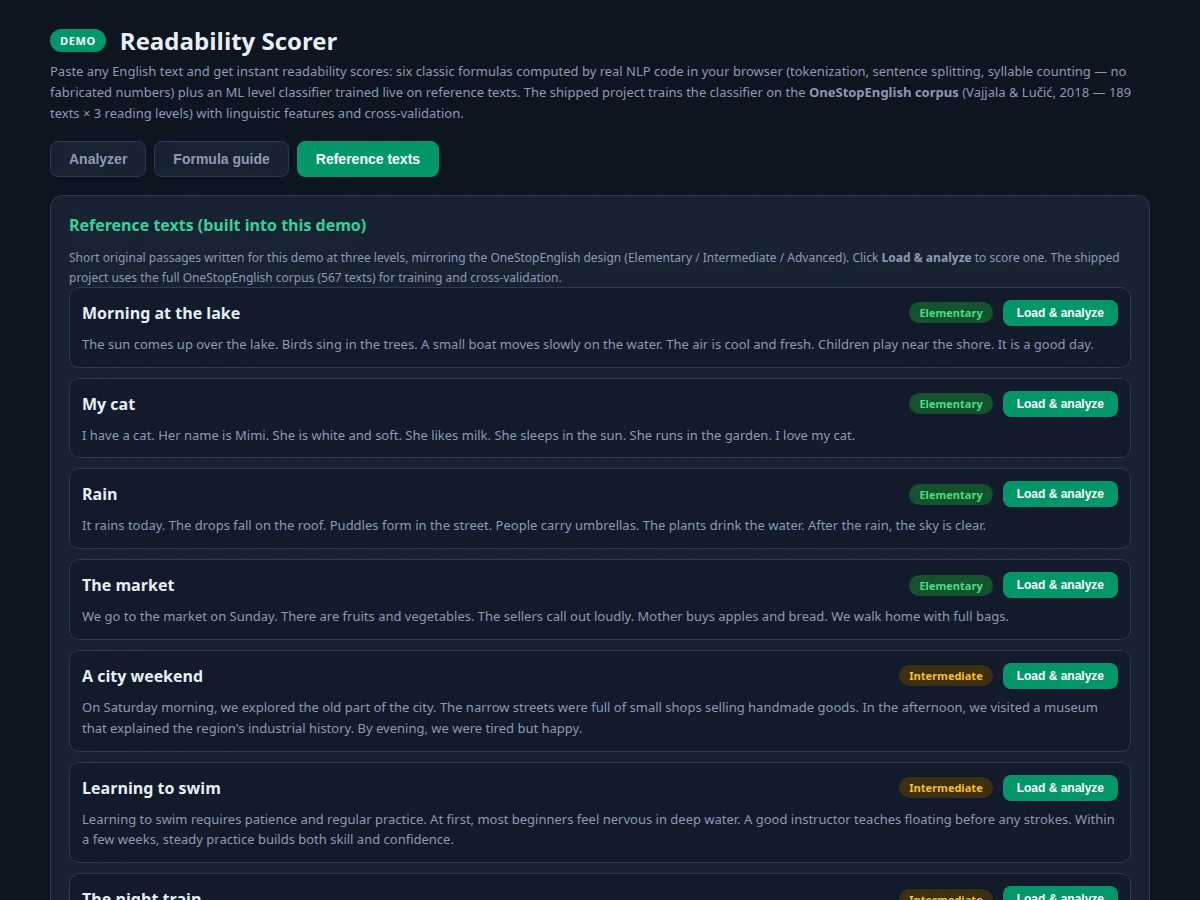
- [Reference text comparison] Built-in sample texts at each level let the viva compare a known-easy and known-hard passage side by side.
- [Sentence-level highlighting] Long or complex sentences are flagged in the input so the user sees exactly where difficulty concentrates.
What is included
- Complete source code (tokenization, syllable counter, six formulas, classifier, demo app)
- Jupyter notebook (formula derivations, classifier training and evaluation)
- Single-file browser demo app with live text analysis
- Project abstract PDF
- Project report (background, formula theory, classifier design, evaluation)
- PPT presentation and viva Q&A document (readability theory, NLP preprocessing, softmax classification)
Limitations & prerequisites
- Formula scores measure surface features (length, syllables), not true comprehension difficulty — vocabulary rarity, coherence and background knowledge are outside their view, and the report says so.
- The syllable counter is rule-based and approximate on unusual words, abbreviations and proper nouns.
- Readability formulas were calibrated on English prose; they are not validated for other languages or for poetry, code or highly formatted documents.
- The classifier is trained on a small reference set; its level predictions are indicative, and its evaluation numbers come from your own build, not from a claim.
Frequently Asked Questions
Is this project suitable for a final-year project?
Yes — it suits Computer Science, AI/ML and Data Science programs, demonstrating NLP preprocessing, classical feature-based formulas and a trained classifier in one build.
Which readability formulas are used?
Six: Flesch Reading Ease, Flesch-Kincaid Grade Level, Gunning Fog, SMOG, Coleman-Liau and ARI — each with its published formula and interpretation scale.
Which dataset is used for the classifier?
Reference texts aligned with the OneStopEnglish corpus design (Elementary/Intermediate/Advanced levels, Vajjala & Lucic 2018); the WeeBit corpus (5 age classes) is discussed as the natural extension.
How accurate is the syllable counting?
It uses rule-based English syllabification (silent-e, diphthongs, affixes). It is accurate on ordinary prose and approximate on abbreviations and proper nouns — documented honestly in the report.
Can it score text in other languages?
The formulas and syllable rules are English-specific; adapting them is possible as an optional customization but is not part of the base build.
Does the demo need a server?
No. The demo is a single HTML file that analyzes text entirely in the browser. Suitable for B.E./B.Tech final-year projects in Computer Science, AI/ML and Data Science.
Components & software requirements
- Python (text processing, formula implementations)
- NLTK / regex tokenization (sentence and word splitting)
- NumPy, scikit-learn (softmax classifier training and evaluation)
- Matplotlib (score distributions, classifier evaluation plots)
- Jupyter notebook (formula walkthrough and classifier training)
- Single-file HTML/CSS/JS demo app (live analysis, metric dashboard)
Delivery information
Built-to-order project. Delivery timeline is shared after order confirmation based on current queue.
Support terms
Complete documentation, setup guide, and viva preparation included. Support for setup and explanation provided.