
More project photos (2)

The problem
Plant diseases destroy a share of every season's yield, yet early diagnosis still depends on a farmer or extension worker inspecting leaves by eye — slow, expert-dependent, and often arriving after the infection has spread. A wrong guess wastes pesticide and yield; a late guess wastes the crop. Convolutional neural networks have proven strong at exactly this task, learning lesion color, texture and shape cues directly from leaf photographs. The PlantVillage dataset (Hughes and Salathe, released through the crowdAI challenge) — roughly 54,305 images across 14 crops and 38 healthy/diseased classes, photographed under controlled conditions — is the standard teaching benchmark. This project trains a CNN on PlantVillage with a stratified split covering all 38 classes, wraps it in an upload-and-diagnose demo app with top-3 predictions and an attention-style visualization, and delivers the full viva kit. Performance is measured on the buyer's own held-out split and reported with an honest confusion-matrix analysis.
How it works
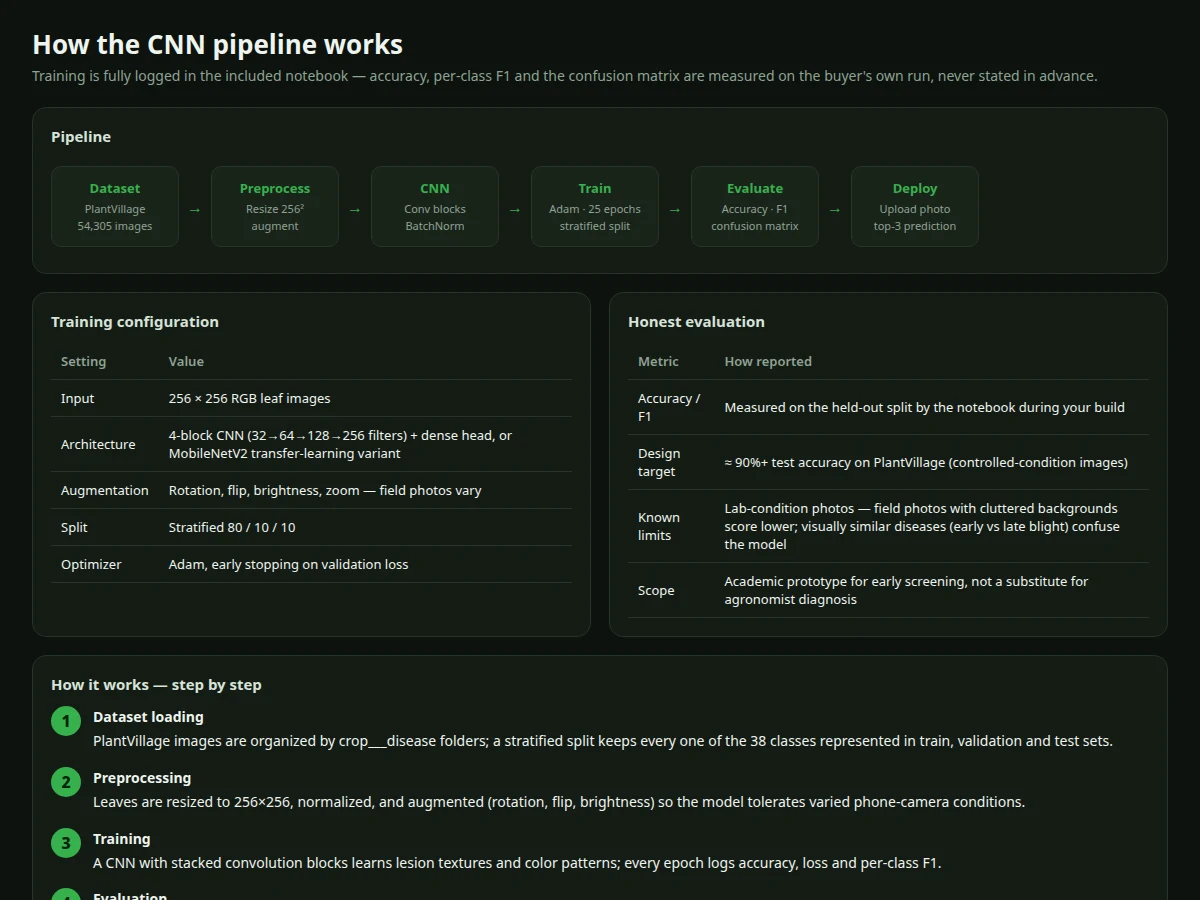
- PlantVillage images (organized in crop___disease folders) are resized to 256x256 and normalized; augmentation is applied on the fly.
- A stratified 80/10/10 split keeps all 38 classes represented in train, validation and test sets.
- The CNN trains with the Adam optimizer and early stopping on validation loss, logging accuracy, loss and per-class F1 every epoch.
- The best-validation checkpoint is kept as the shipped weights; final metrics are computed on the held-out test split.
- The confusion matrix is analyzed for confusions between visually similar diseases (e.g. tomato early vs late blight) and discussed in the report.
- The demo app runs inference on an uploaded photo in under a second on CPU and displays the top-3 classes with confidence bars.
- An attention-style heatmap overlays the regions the network weighed most, aiding the viva explanation.
Tech stack:
- Python 3.10, TensorFlow/Keras (CNN training and inference)
- NumPy, pandas (data handling and metrics tables)
- scikit-learn (metrics, confusion matrix)
- Matplotlib, Seaborn (training curves, per-class analysis)
- Flask demo app with leaf-photo upload UI
- PlantVillage dataset (Hughes & Salathe, crowdAI release; Kaggle mirrors)
- Single-file HTML/CSS/JS browser demo (detect, class browser, method views)
| Parameter | Value |
|---|---|
| Dataset | PlantVillage: approximately 54,305 images, 38 classes, 14 crops |
| Input | 256x256 RGB leaf images |
| Model | 4-block CNN (32/64/128/256 filters) + 38-way softmax; MobileNetV2 variant documented |
| Split | Stratified 80/10/10 across all 38 classes |
| Training | Adam optimizer, categorical cross-entropy, early stopping, up to 25 epochs |
| Augmentation | Rotation, flip, brightness, zoom |
| Evaluation | Test accuracy, macro-F1, confusion matrix — computed on your build |
| Design target | Approximately 90%+ test accuracy on controlled-condition images |
| Inference | Under a second on CPU per photo; top-3 predictions with confidence bars |
| Scope | Academic prototype for early screening, not a substitute for agronomist diagnosis |
Project features
- [Leaf photo diagnosis] Upload a leaf photo and get the most likely crop-disease class with a confidence score and a ranked top-3 list.
- [38-class PlantVillage coverage] All 14 crops and 38 healthy/diseased classes of the benchmark, with a class browser in the demo app.
- [CNN classifier] Four convolution blocks (32/64/128/256 filters) with batch normalization, global average pooling and a 38-way softmax; a MobileNetV2 transfer-learning variant is documented.
- [Stratified training] 80/10/10 split with stratification so every one of the 38 classes appears in train, validation and test sets.
- [Field-tolerant augmentation] Rotation, flip, brightness and zoom augmentation so the model tolerates varied phone-camera conditions.
- [Full evaluation logging] Accuracy, per-class F1 and the confusion matrix computed on the held-out split — measured, never pre-claimed.
- [Attention-style visualization] A heatmap overlay highlighting the high-texture regions the network weighed most in its decision.
- [Complete student kit] Training notebook, saved weights, inference script, demo app, project report, PPT and viva Q&A.
What is included
- Complete source code (data pipeline, training, evaluation, inference, demo app)
- Jupyter training notebook (buyer-run procedure: prepare data, train, evaluate, analyze errors)
- Trained model weights exported from the included training run
- Project report PDF (background, PlantVillage analysis, methodology, evaluation, error analysis)
- PPT presentation for final review
- Viva Q&A preparation document (CNNs, augmentation, transfer learning, PlantVillage, evaluation metrics)
- Setup guide (environment, dataset download, training, running the demo)
Limitations & prerequisites
- PlantVillage images are photographed under controlled conditions — field photos with cluttered backgrounds and uneven lighting score lower, and the report states this openly.
- Visually similar diseases confuse the model (tomato early vs late blight is the classic pair); the confusion matrix documents this rather than hiding it.
- The design target of approximately 90%+ applies to the controlled-condition test split; final numbers are measured during your build, not guaranteed.
- 256x256 input resolution limits very fine lesion detail; higher resolution is a documented extension with its training-cost tradeoff.
- Best results need a single leaf reasonably framed in the photo; heavy occlusion or multiple overlapping leaves degrade predictions.
- This is an academic screening prototype — it does not replace agronomist diagnosis or laboratory testing.
Frequently Asked Questions
Which dataset is used?
PlantVillage (Hughes and Salathe, released through the crowdAI plant-disease challenge): approximately 54,305 leaf images across 14 crops and 38 healthy/diseased classes, organized in crop___disease folders.
How does the CNN detect disease?
The network learns visual cues — lesion color, texture and shape — directly from pixels. The demo's attention-style heatmap shows which high-texture regions the model weighed most for a given photo.
Is the accuracy guaranteed?
No. The design target is approximately 90%+ test accuracy on the controlled-condition PlantVillage split, but the final metrics are computed by the training notebook during your build and documented in the report with the confusion matrix.
Will it work on photos I take in the field?
Less reliably than on lab-condition images — cluttered backgrounds and uneven lighting are outside the dataset's distribution. The report states this as an explicit limitation; fine-tuning on field photos is the documented extension.
Which diseases does it confuse?
Visually similar ones, most famously tomato early blight vs late blight. The report analyzes these confusions with the confusion matrix instead of claiming perfection.
Is this project suitable for a final-year project?
Yes — for Computer Science, AI/ML and Data Science programs. It demonstrates CNN classification, augmentation, transfer learning, stratified evaluation and honest error analysis, all strong viva material. Suitable for B.E./B.Tech final-year projects in Computer Science, AI/ML and Data Science.
Components & software requirements
- Python 3.10, TensorFlow/Keras (CNN training and inference)
- NumPy, pandas (data handling and metrics tables)
- scikit-learn (metrics, confusion matrix)
- Matplotlib, Seaborn (training curves, per-class analysis)
- Flask demo app with leaf-photo upload UI
- PlantVillage dataset (Hughes & Salathe, crowdAI release; Kaggle mirrors)
- Single-file HTML/CSS/JS browser demo (detect, class browser, method views)
Delivery information
Built-to-order project. Delivery timeline is shared after order confirmation based on current queue.
Support terms
Complete documentation, setup guide, and viva preparation included. Support for setup and explanation provided.