
More project photos (2)

The problem
When a security incident is suspected, responders capture network traffic — but a raw PCAP opened in Wireshark is thousands of packets a student doesn't know how to read. Professionals don't start by scrolling: they summarize first (who talked to whom, which protocols dominated, what looks unusual) and drill into packets only where the summary points. Students lack tooling for that first step, so coursework stays at "here is a TCP handshake" while real analysis stays out of reach. This project automates the summarization: the Wireshark CLI engine (tshark) does the protocol dissection, a Python analyzer aggregates flows, extracts DNS/HTTP/TLS metadata and applies documented heuristic flags, and a Jinja-templated HTML report presents the case. The scope is educational forensics on captures you own — not an intrusion-detection product, and the heuristics make no accuracy claims.
How it works
- The analyst loads a PCAP/PCAPNG capture file into the tool (captures you own or have permission to analyze).
- tshark exports the packet list as structured JSON with full dissector fields.
- The Python analyzer aggregates packets into flows, builds the protocol hierarchy, and ranks top talkers, ports and domains.
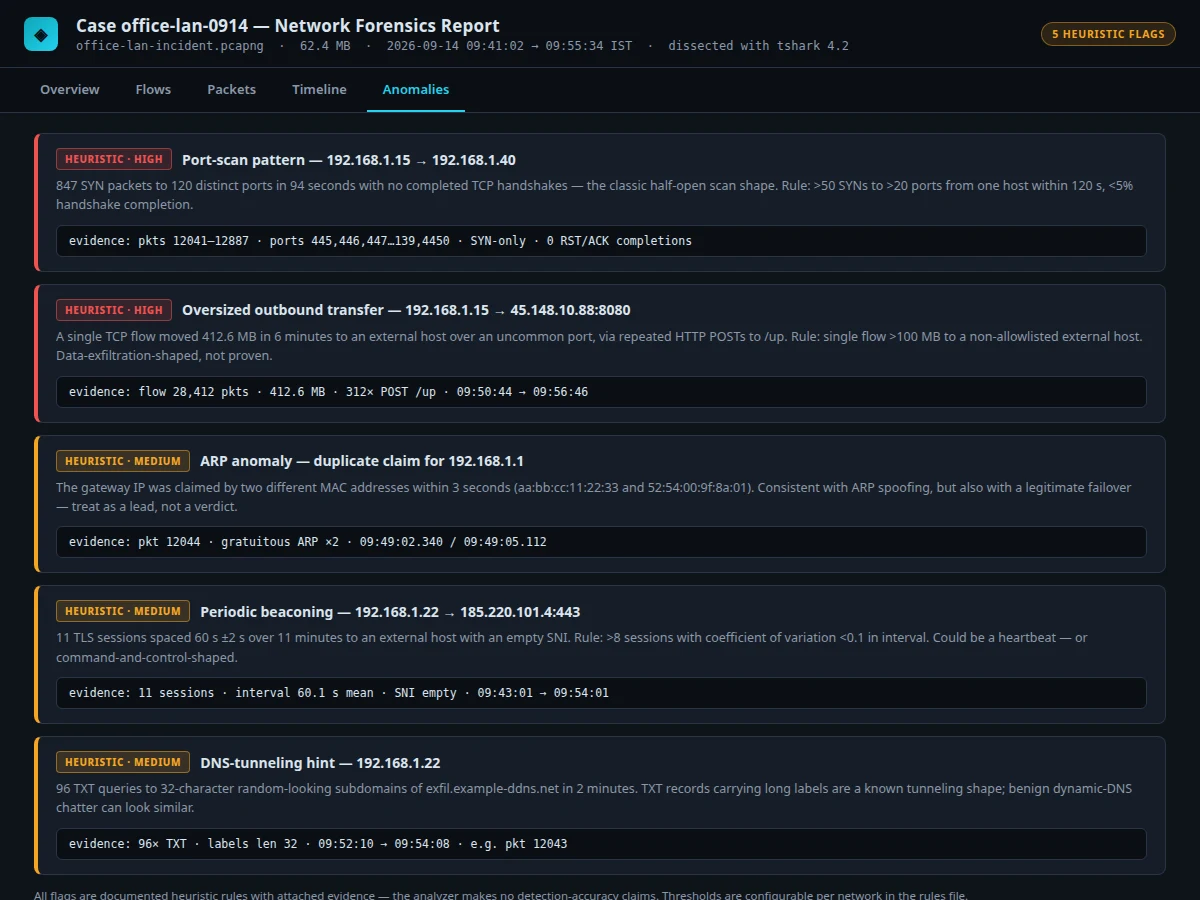
- Heuristic rules scan the aggregates for port-scan patterns, ARP anomalies, beaconing periodicity, oversized transfers and DNS oddities, attaching evidence to each flag.
- Findings are stored in a SQLite case database with the analyst's notes.
- A Jinja2 template renders the self-contained HTML report — summary, flags, flow tables, timeline and charts — for the browser.
Tech stack:
- Python 3.10 (analyzer, heuristics, CLI)
- tshark (Wireshark CLI) for packet dissection
- pyshark / tshark JSON export pipeline
- SQLite case database with analyst notes
- Jinja2 HTML report templates
- Chart.js charts embedded in the report
- Scapy for generating synthetic test captures
- Single-file HTML report viewer (demo)
| Parameter | Value |
|---|---|
| Analysis engine | tshark (Wireshark CLI) — full protocol dissectors |
| Language | Python 3.10 |
| Input | PCAP / PCAPNG captures readable by tshark |
| Case storage | SQLite database with analyst notes |
| Report | Self-contained single-file HTML (Jinja2 + embedded Chart.js), opens offline |
| Heuristics | Port-scan, ARP anomaly, beaconing, oversized transfer, DNS-tunneling hints — all labeled heuristic |
| Test captures | Synthetic captures generated with Scapy for repeatable demos |
| Platform | Windows / Linux desktop; requires Wireshark/tshark installed |
Project features
- [tshark-powered dissection] Packet parsing uses the real Wireshark CLI engine, so every protocol dissector Wireshark knows is available — no half-baked custom parser.
- [Case summary dashboard] Packet and byte counts, protocol hierarchy, top talkers, top ports and busiest flows at a glance.
- [Heuristic anomaly flags] Documented rules flag port-scan patterns, ARP table anomalies, periodic beaconing, oversized single-flow transfers and DNS tunneling hints — each labeled as a heuristic, not a verdict.
- [Flow table with packet drill-down] Click from a flow summary into its packets with decoded fields, following the analyst's summarize-then-drill workflow.
- [DNS, HTTP and TLS intelligence] Queried domains, HTTP hosts and URIs, TLS SNI values and user-agent strings extracted into dedicated panels.
- [Timeline view] Key events plotted over capture time to build the investigative narrative for the report.
- [Self-contained HTML case report] The Jinja-rendered report bundles summary, flags, flows and charts into one file that opens offline in any browser.
What is included
- Complete Python source code (analyzer, heuristics, report generator)
- Jinja2 report templates and the HTML report viewer demo
- Synthetic Scapy-generated sample captures for demos
- Setup guide (Python environment, Wireshark/tshark install)
- Heuristics documentation (what each rule checks and its limits)
- Project abstract PDF
- Project report (background, methodology, protocol analysis, case walkthrough)
- PPT presentation and viva Q&A document
Limitations & prerequisites
- The flags are documented heuristic rules, not a trained detector or IDS — no detection-accuracy claims are made, and rules need tuning for each network.
- Encrypted traffic yields metadata only (SNI, sizes, timing); payloads stay opaque, which the report states explicitly.
- Very large captures (multi-gigabyte) need proportional RAM and processing time; expectations are labeled approximate.
- Wireshark/tshark must be installed separately; the tool analyzes capture files offline — live interface capture is a documented optional extension.
- Analyze only captures you own or have explicit permission to inspect; the guide includes a legal/ethical-use note.
Frequently Asked Questions
Is this project suitable for a final-year project?
Yes — for Computer Science, IT and Cybersecurity programs, covering packet analysis, protocol behavior, heuristic design and forensic reporting.
Does it detect malware?
No. It flags suspicious traffic patterns with documented heuristics and evidence; it does not classify malware or guarantee detection.
What input does it take?
Any PCAP/PCAPNG capture that tshark can read, plus the synthetic Scapy-generated samples included for repeatable demos.
Do I need Wireshark installed?
Yes — the analyzer drives tshark, the Wireshark command-line engine, for dissection.
Can it analyze encrypted traffic?
Only its metadata: TLS SNI, packet sizes, timing and flow endpoints. Encrypted payloads remain unreadable, as the report states.
What are the main limitations?
Heuristic (not guaranteed) flags, metadata-only encrypted analysis, large-capture resource needs and offline-file scope — detailed under Limitations. Suitable for B.E./B.Tech final-year projects in Computer Science, IT and Cybersecurity.
Components & software requirements
- Python 3.10 (analyzer, heuristics, CLI)
- tshark (Wireshark CLI) for packet dissection
- pyshark / tshark JSON export pipeline
- SQLite case database with analyst notes
- Jinja2 HTML report templates
- Chart.js charts embedded in the report
- Scapy for generating synthetic test captures
- Single-file HTML report viewer (demo)
Delivery information
Built-to-order project. Delivery timeline is shared after order confirmation based on current queue.
Support terms
Complete documentation, setup guide, and viva preparation included. Support for setup and explanation provided.