
More project photos (2)
The problem
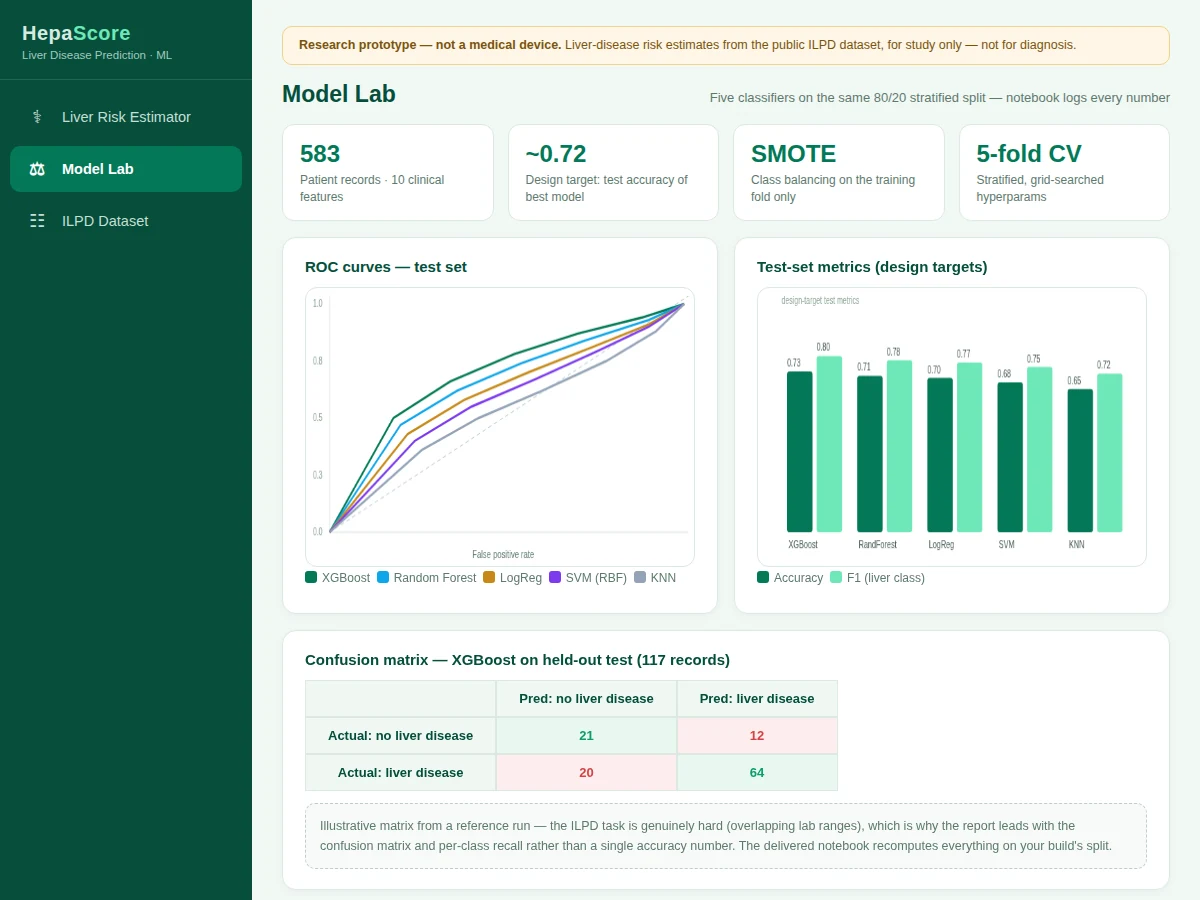
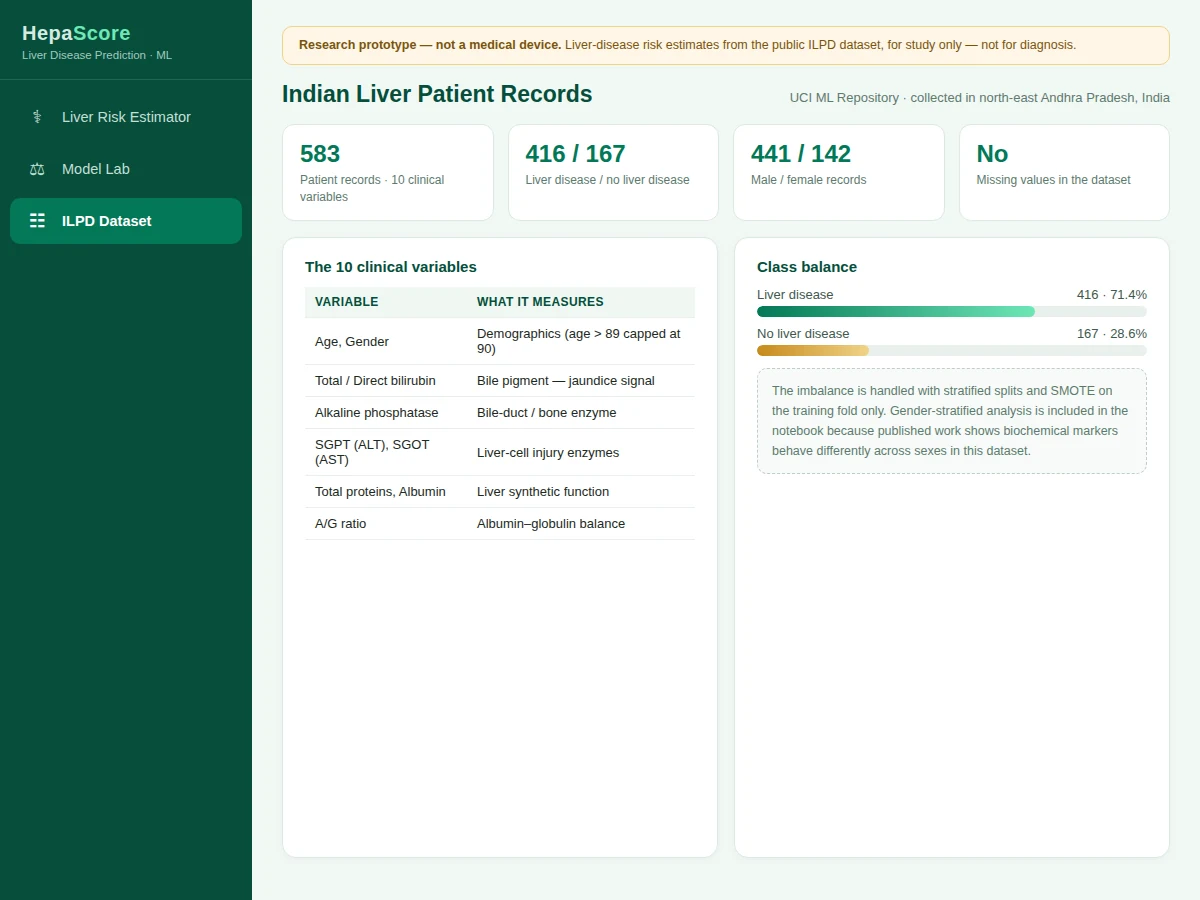
Liver disease is a leading cause of adult mortality in India, yet its early biochemical signals — rising bilirubin, climbing transaminases (SGPT/SGOT), falling albumin — sit in routine blood panels long before symptoms appear. Reading those panels is pattern recognition over ten correlated variables, exactly the kind of judgment that varies between clinicians and degrades under workload. The Indian Liver Patient Records dataset (UCI Machine Learning Repository, 583 records collected in north-east Andhra Pradesh) captures this problem in public form: 416 liver-disease and 167 healthy records across 10 clinical variables. It is also a genuinely hard classification task — the lab ranges of the two classes overlap heavily, so no honest build reports 95% accuracy. This project embraces that difficulty: five classifiers (XGBoost, random forest, logistic regression, SVM, KNN) compared on the same stratified split, SMOTE applied to the training fold only, and an evaluation that leads with the confusion matrix and per-class recall.
How it works
- The Indian Liver Patient Records dataset (583 records, 10 clinical variables, binary selector label) is loaded and profiled for class balance and gender distribution.
- Features are standardized with StandardScaler; gender is encoded and the data is split 80/20 with stratification.
- SMOTE oversampling is applied to the training fold only, balancing the classes for learning while the test set stays natural.
- Five classifiers are trained with grid-searched hyperparameters under 5-fold stratified cross-validation.
- Each model is evaluated on the untouched test split with the confusion matrix, per-class precision/recall/F1 and ROC-AUC; a gender-stratified breakdown is computed.
- The best model is serialized, and the estimator interface loads it to score new profiles live with per-variable contribution bars.
Tech stack:
- Python 3.10, scikit-learn (LogReg, Random Forest, SVM, KNN, scaling)
- XGBoost (gradient-boosted trees classifier)
- imbalanced-learn (SMOTE on the training fold)
- pandas, NumPy (data handling, stratified analysis)
- Matplotlib, Seaborn (confusion matrices, ROC curves)
- Jupyter notebook (buyer-run training and evaluation)
- HTML/CSS/JS demo (risk-estimator interface with reference ranges)
| Parameter | Value |
|---|---|
| Dataset | Indian Liver Patient Records, UCI ML Repository (583 records, 10 variables, 2 classes) |
| Models | XGBoost, Random Forest, Logistic Regression, SVM (RBF), KNN |
| Design target | ~0.72 test accuracy for the best model; final numbers measured by the notebook on your build |
| Evaluation | Confusion matrix, per-class precision/recall/F1, ROC-AUC — computed on your test split |
| Imbalance | Stratified splits + SMOTE on training fold only |
| Input | 10 clinical variables (age, gender, bilirubin, Alkphos, SGPT, SGOT, proteins, albumin, A/G) |
| Output | Liver-disease probability with per-variable contribution explanation |
Project features
- [Five-model comparison] XGBoost, random forest, logistic regression, SVM (RBF) and KNN on the same stratified 80/20 split of the ILPD data
- [Honest imbalance handling] Stratified splits throughout and SMOTE applied to the training fold only — the test set keeps its natural 71/29 distribution
- [Confusion-matrix-led evaluation] Per-class precision, recall and F1 plus ROC-AUC, because a single accuracy number hides the minority-class story on this dataset
- [Risk estimator interface] Enter the 10 ILPD clinical variables with reference ranges shown, and get a live risk probability with per-variable contributions
- [Gender-stratified analysis] Published work shows biochemical markers behave differently across sexes in this dataset — the notebook measures it instead of ignoring it
- [Cross-validated tuning] 5-fold stratified cross-validation with grid search over each model's key hyperparameters
- [Error analysis] Which records get misclassified, which lab patterns confuse the models, and what that implies for feature engineering
- [Reproducible experiment] Fixed seeds, requirements file and a single notebook that reruns the entire pipeline end to end
What is included
- Complete source code (preprocessing, SMOTE pipeline, training, evaluation, demo interface)
- Jupyter training and evaluation notebook (buyer-run: the full experiment reruns on your machine)
- Project report PDF (background, dataset analysis, methodology, results, error analysis)
- PPT presentation for final review
- Viva Q&A preparation document (class imbalance, SMOTE, confusion matrix reading, liver biomarkers)
- Setup guide (environment, dataset download, running the notebook, using the estimator)
Limitations & prerequisites
- This is an academic research prototype, not a medical device: it must not be used for diagnosis or clinical decisions, and the demo carries that disclaimer visibly.
- The ILPD task is genuinely hard — overlapping lab ranges mean even the best model misclassifies a substantial minority; the report presents this honestly instead of chasing a flattering number.
- The dataset comes from one region of India with a strong male skew (441/142); the model should not be assumed to transfer to other populations.
- SMOTE synthesizes minority-class examples — it helps the classifier learn but the synthetic points are not real patients, and the report states this.
- Ten variables cannot capture liver disease fully; imaging, history and clinical examination carry information the model never sees.
- The estimator interface scores demo input profiles; it is a visualization of the trained model, not a screening tool.
Frequently Asked Questions
Which dataset is used?
The Indian Liver Patient Records dataset from the UCI Machine Learning Repository: 583 records with 10 clinical variables — age, gender, total and direct bilirubin, alkaline phosphatase, SGPT, SGOT, total proteins, albumin and the albumin/globulin ratio — labeled liver-disease or not.
Why is the accuracy target lower than other disease-prediction projects?
Because this dataset is honestly difficult: the lab values of healthy and diseased patients overlap heavily. Published builds cluster in the high-60s to mid-70s. A project that reports this openly, with the confusion matrix front and center, is more credible than one that claims 95%.
How is the class imbalance handled?
Stratified splits keep the 71/29 ratio intact everywhere it matters, and SMOTE oversampling is applied to the training fold only — never to validation or test data, which would leak synthetic information into the evaluation.
Is the accuracy guaranteed?
No. The design target is around 0.72 test accuracy, but the report documents whatever the notebook measures on your build's split — confusion matrix, per-class recall and all.
Is this a medical diagnosis tool?
No. It is an educational prototype on public research data and must not be used for diagnosis or clinical decisions.
What will I receive with the project?
Complete source code, the training and evaluation notebook, project report PDF, PPT presentation, viva Q&A document and a setup guide. Suitable for B.E./B.Tech final-year projects in Computer Science, AI/ML and Data Science.
Components & software requirements
- Python 3.10, scikit-learn (LogReg, Random Forest, SVM, KNN, scaling)
- XGBoost (gradient-boosted trees classifier)
- imbalanced-learn (SMOTE on the training fold)
- pandas, NumPy (data handling, stratified analysis)
- Matplotlib, Seaborn (confusion matrices, ROC curves)
- Jupyter notebook (buyer-run training and evaluation)
- HTML/CSS/JS demo (risk-estimator interface with reference ranges)
Delivery information
Built-to-order project. Delivery timeline is shared after order confirmation based on current queue.
Support terms
Complete documentation, setup guide, and viva preparation included. Support for setup and explanation provided.