
More project photos (4)
The problem
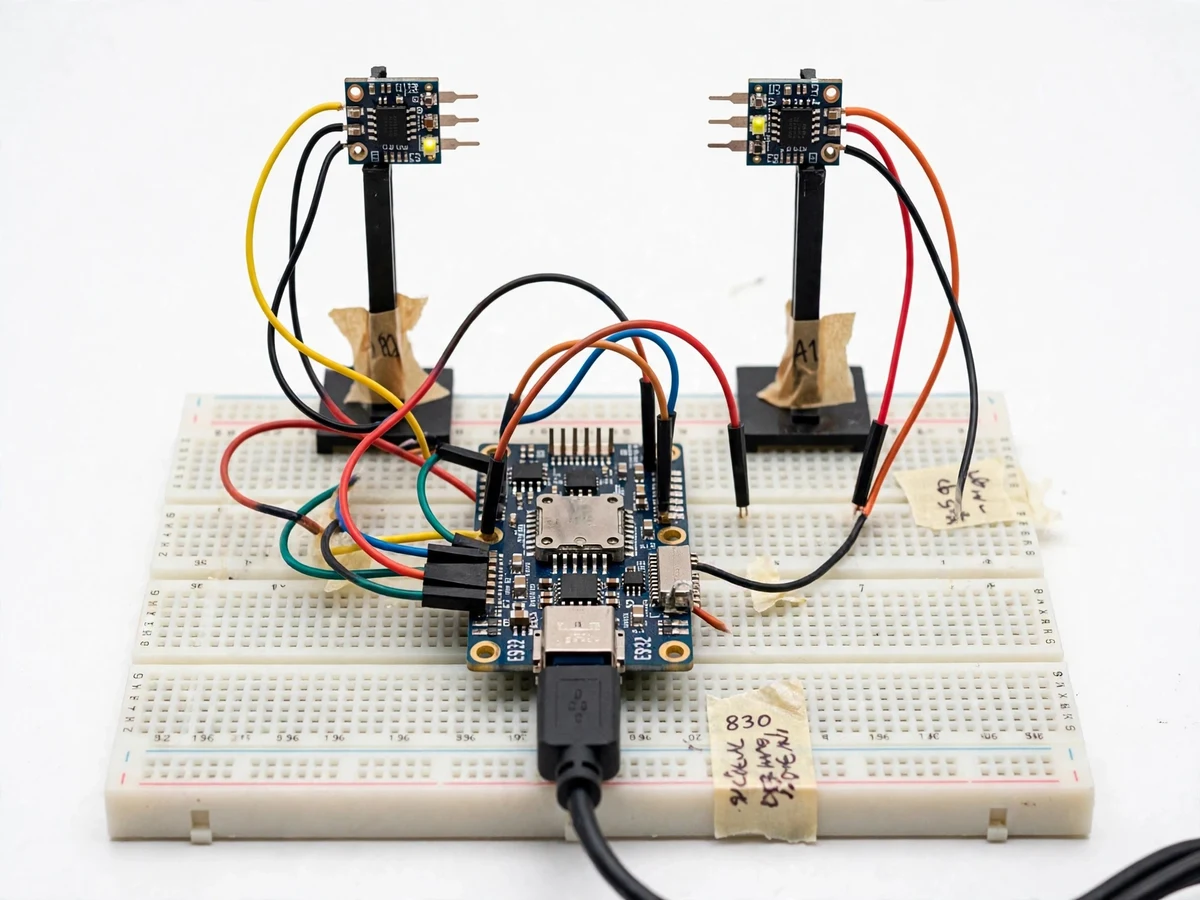
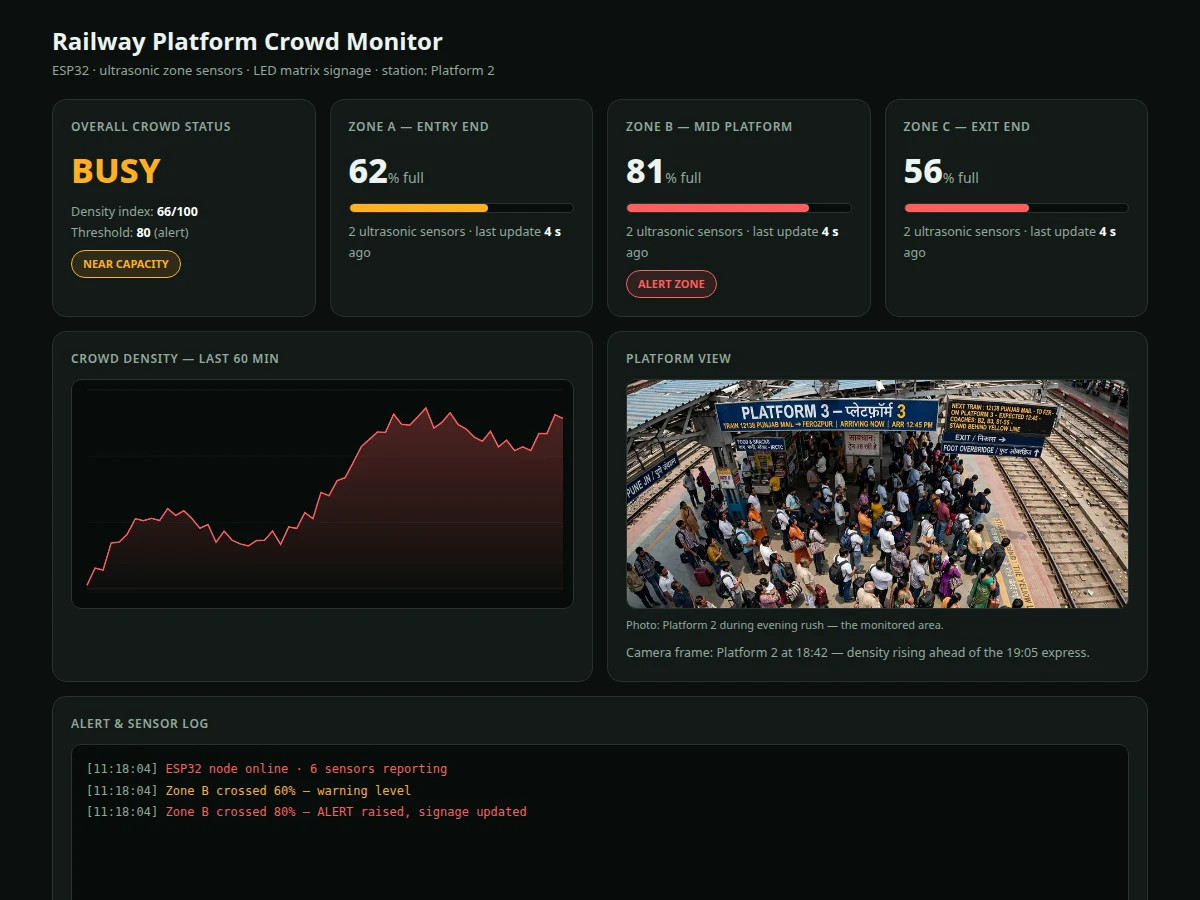
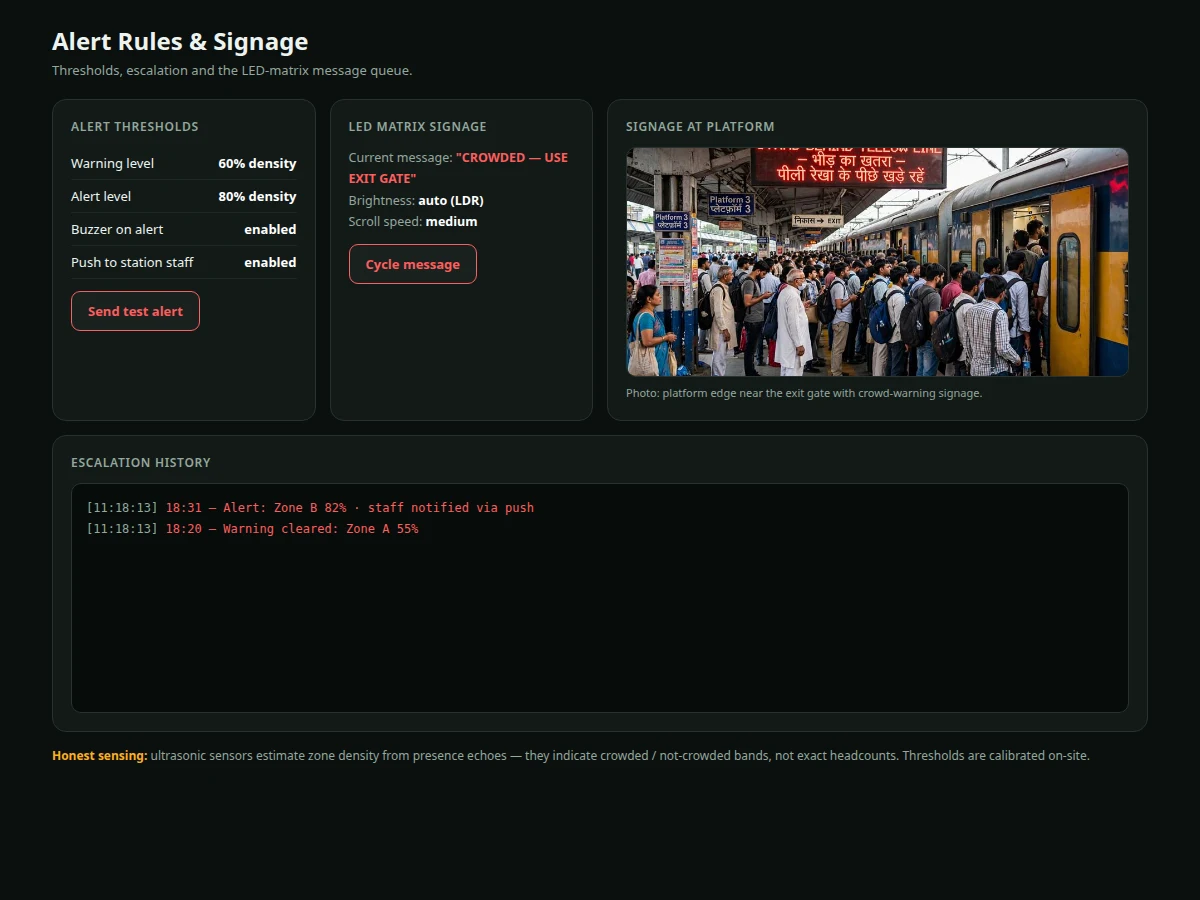
Festival seasons and evening rush hours push Indian railway platforms past comfortable — and safe — densities, yet crowd control still depends on staff eyeballing the platform. A cheap, always-on density estimate per platform zone would let staff act before a zone chokes: open another exit gate, hold passengers at the footbridge, or dispatch RPF to the dense end. This project builds exactly that as a student-scale system: HC-SR04 ultrasonic sensors mounted at intervals along a platform (or a lab-scale platform model) divide it into three zones; an ESP32 polls each sensor, smooths the readings and maps them to a 0–100 density index per zone. Crossing the warning level (60%) updates the dashboard; crossing the alert level (80%) drives a red LED-matrix sign with a scrolling message, sounds a buzzer and fires a push alert to the staff channel over Wi-Fi/MQTT. The dashboard — the software half of this hybrid build — shows per-zone gauges, a rolling 60-minute density chart, the current signage message and an escalation history. Because ultrasonic echoes measure presence in a zone rather than counting heads, the report is explicit: the system reports density bands, and the on-site calibration procedure (empty / normal / rush readings) is what makes the thresholds meaningful.
How it works
- Each HC-SR04 pair measures distance to the nearest bodies in its zone; shorter, noisier echoes indicate a denser crowd.
- The ESP32 samples every few seconds, applies a moving average, and converts the smoothed distance into a per-zone density index (0–100).
- The index is compared against calibrated thresholds: below 60% is normal, 60–80% is warning, above 80% is alert.
- On warning, the dashboard gauge changes state; on alert, the LED matrix switches to the alert message, the buzzer sounds and a push alert fires.
- Every reading, threshold crossing and signage change is published over MQTT to the dashboard's gauges, chart and event log.
- Staff acknowledge or escalate from the alert console; the escalation history records what happened, when, and in which zone.
- If Wi-Fi drops, the node keeps sensing and driving the sign locally; telemetry backfills when the link returns.
Tech stack:
- ESP32 DevKit (Arduino-core firmware, Wi-Fi + MQTT)
- HC-SR04 ultrasonic sensors (6x, two per zone)
- 32x8 red LED matrix display module + buzzer
- MQTT broker + web dashboard (HTML/CSS/JS, MQTT over WebSockets)
- 5 V USB / regulated supply for the node
| Parameter | Value |
|---|---|
| Controller | ESP32 DevKit, Arduino-core firmware |
| Sensors | 6x HC-SR04 ultrasonic, 2 cm – 400 cm range, 3 zones |
| Sensing output | Density index 0–100 per zone; bands (normal/warning/alert), not headcounts |
| Signage | 32x8 red LED matrix, scrolling messages, auto brightness |
| Alerts | Buzzer + push to staff channel on alert level |
| Thresholds | Warning 60%, alert 80% — set by on-site calibration procedure |
| Connectivity | MQTT over Wi-Fi; dashboard via WebSockets |
| Alert latency | Design target under 5 s on local Wi-Fi (not guaranteed on congested networks) |
| Power | 5 V USB supply for node and signage |
| Dashboard | Zone gauges, 60-min density chart, signage preview, alert/escalation log |
Project features
- [Zone-wise ultrasonic density sensing] Three platform zones, two HC-SR04 sensors per zone, polled and smoothed by the ESP32 into a 0–100 density index.
- [ESP32 alert firmware] Wi-Fi/MQTT telemetry, threshold state machine (normal / warning / alert), and local decision-making that keeps working if the dashboard link drops.
- [LED-matrix crowd signage] 32x8 red LED matrix scrolling context messages ("CROWDED — USE EXIT GATE") with ambient-light brightness control.
- [Buzzer + staff push alerts] Local buzzer on alert level plus push notification to the station-staff channel with zone and density.
- [Live crowd dashboard] Per-zone occupancy gauges, overall crowd status pill, 60-minute density chart, current signage preview and timestamped alert log.
- [On-site threshold calibration] Empty/normal/rush baseline procedure that sets the warning (60%) and alert (80%) levels for the actual installation geometry.
- [Alert rules console] Editable thresholds, message queue for the LED sign, and an escalation history view for post-incident review.
What is included
- Complete ESP32 firmware (sensing, smoothing, threshold state machine, MQTT, signage driver)
- Sensor node + LED-matrix signage hardware, wired and tested
- Crowd dashboard web app (gauges, chart, alert console, escalation history)
- Wiring diagram and sensor-mounting guide for the platform/model geometry
- Threshold calibration guide (empty/normal/rush baseline procedure)
- Project report PDF (background, sensing method, firmware design, honest accuracy discussion)
- PPT presentation for final review
- Viva Q&A preparation document (ultrasonics, ESP32, MQTT, threshold design, calibration)
- Setup guide (broker setup, Wi-Fi provisioning, first calibration run)
Limitations & prerequisites
- Ultrasonic sensors estimate density bands — they do not count people. Exact headcounts, flow direction and demographics are outside what this sensing method can deliver, and the report states this plainly.
- Thresholds must be calibrated on-site for the actual mounting heights and geometry; lab defaults are starting points only.
- Outdoor platform deployment needs a weatherproof (IP65) enclosure and protected cable runs, which the buyer provides — the kit ships as an indoor/demo-grade assembly.
- Alerts depend on Wi-Fi; the node keeps sensing and driving the sign locally during outages, but staff push alerts pause until the link returns.
- This is an advisory aid for crowd management, not a certified safety system — it supports staff decisions, it does not replace them.
- Dense luggage trolleys and slow-moving queues can read as high density; the calibration guide documents these confounders.
Frequently Asked Questions
How does it detect crowds?
Ultrasonic sensors measure how close the nearest bodies are in each zone; the ESP32 smooths these readings into a 0–100 density index per zone. It estimates crowded / busy / normal bands — it does not count individual people.
What happens when a zone gets too crowded?
Crossing 80% density raises an alert: the LED matrix shows a warning message, the buzzer sounds, and station staff get a push alert with the zone and density. Warnings at 60% update the dashboard first.
How are the thresholds set?
With an on-site calibration you run yourself: record sensor readings when the platform is empty, normal and rush-hour busy, and the guide maps those to the 60%/80% levels for your geometry.
Does it work without internet?
The node keeps sensing and driving the signage on local logic without Wi-Fi; only the staff push alerts and remote dashboard pause until the link returns.
Can it count exact numbers of people?
No — and the report says so explicitly. Ultrasonic presence sensing cannot resolve individuals; for counting you would need a camera-based system, documented as the extension path.
Is this project suitable for a final-year project?
Yes — for Electronics, Electrical and IoT programs. It demonstrates sensor interfacing, signal smoothing, threshold state machines, MQTT telemetry and honest sensing limits, all strong viva material. Suitable for B.E./B.Tech final-year projects in Electronics, Electrical and IoT.
Components & software requirements
- ESP32 DevKit (Arduino-core firmware, Wi-Fi + MQTT)
- HC-SR04 ultrasonic sensors (6x, two per zone)
- 32x8 red LED matrix display module + buzzer
- MQTT broker + web dashboard (HTML/CSS/JS, MQTT over WebSockets)
- 5 V USB / regulated supply for the node
Delivery information
Built-to-order project. Delivery timeline is shared after order confirmation based on current queue.
Support terms
Complete documentation, setup guide, and viva preparation included. Support for setup and explanation provided.