
More project photos (2)
The problem
Clinicians assess walking problems with force plates that cost lakhs and live in hospital labs — far out of reach of a student project, a physiotherapy student, or a sports coach. This project shrinks the concept into a shoe: eight force-sensitive resistors laminated into a flexible insole, sampled at 50 Hz by a small Bluetooth microcontroller, streamed to a web app that draws the foot's pressure map live. The app records walking sessions and computes the parameters gait analysis actually uses — cadence, stance/swing split, double-support time, peak pressures per zone and left-right symmetry — then plots the average gait cycle and flags asymmetries beyond a configurable threshold. The student gets a genuine embedded + signal-processing project: sensor interfacing, wireless streaming, real-time visualization and biomechanical parameter extraction. Because sensor placement, shoe fit and walking surface all affect readings, the kit makes no clinical claim — it is a screening and learning aid, and the report presents the student's own measured session data with a documented calibration procedure.
How it works
- The sensor insole is placed in the student's shoe and paired to the web app over Bluetooth Low Energy.
- The ESP32 samples all eight force sensors at 50 Hz, applies the calibration curve, and streams pressure packets to the browser.
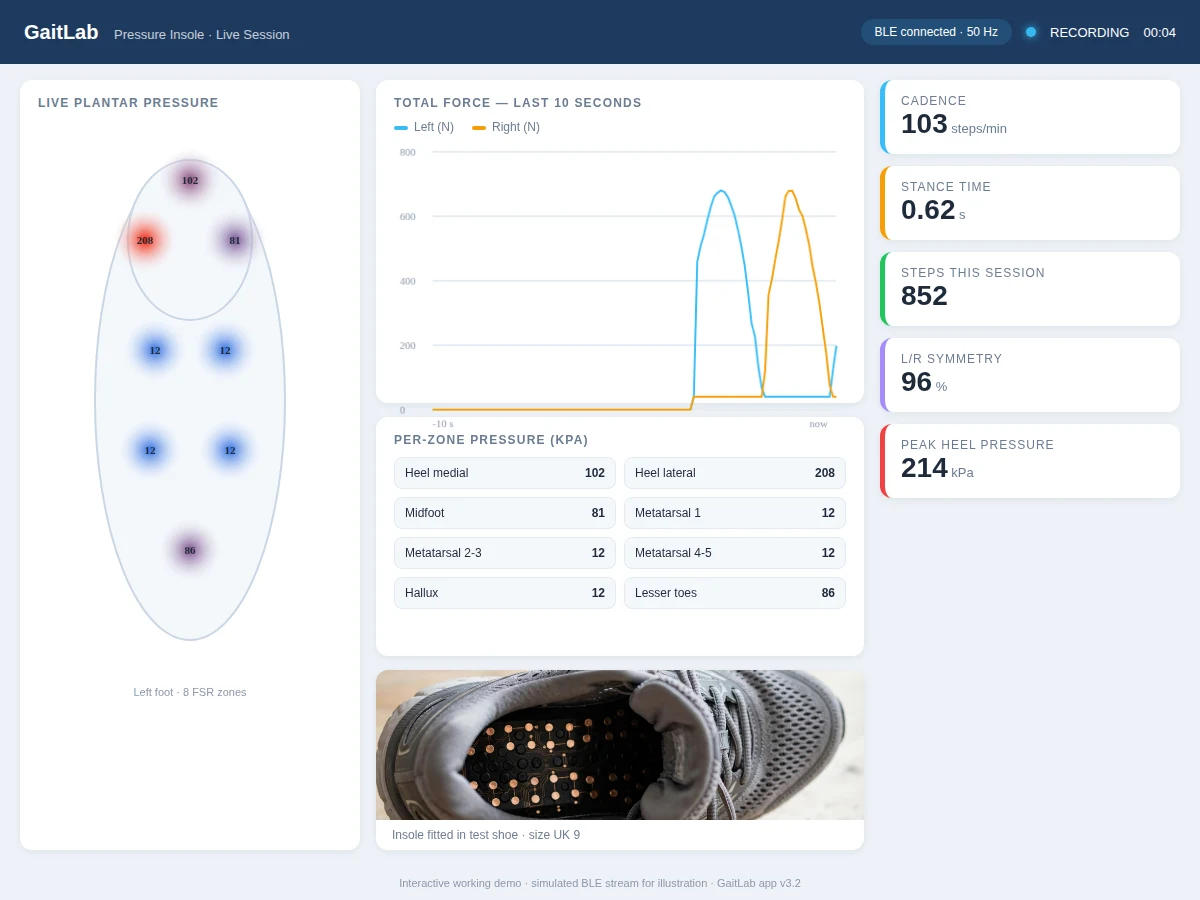
- The live page draws the plantar heatmap, updates per-zone kilopascal readouts, and plots the rolling left/right force curves.
- The student performs a walk test (e.g. 10 metres); the app detects steps from the force signal and records the session.
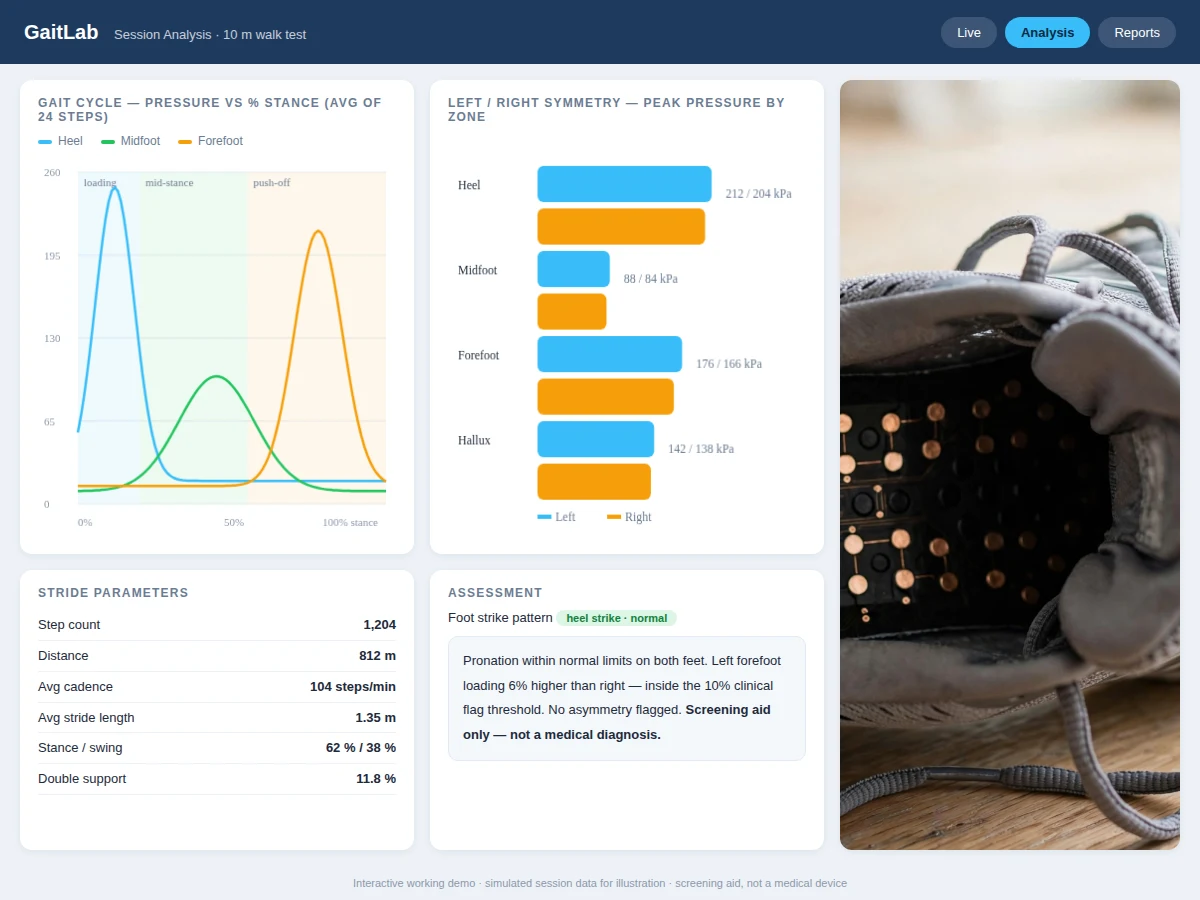
- The analysis page averages the steps into gait-cycle curves, computes symmetry bars and stride parameters, and renders the foot-strike assessment.
- Session data exports as CSV; the report presents the student's own walk-test results with the calibration method and a clear non-medical disclaimer.
Tech stack:
- 8× FSR-402 thin-film force sensors on flexible insole substrate
- ESP32 BLE microcontroller, LiPo cell with charging module
- GaitLab web app (BLE WebBluetooth, canvas heatmap and charts, CSV export)
- 3D-printed ankle-mount enclosure for electronics (optional wear config)
- Calibration rig procedure (body-weight reference method)
- Session analysis engine (step detection, cycle averaging, symmetry metrics)
| Parameter | Value |
|---|---|
| Sensing zones | 8 per insole (heel ×2, midfoot, metatarsals ×3, hallux, toes) |
| Sampling | 50 Hz per channel, 10-bit ADC |
| Wireless | Bluetooth Low Energy to browser (WebBluetooth) |
| Battery | LiPo, approx. 3–4 h continuous streaming (typical) |
| Pressure range | Approx. 10–250 kPa after calibration (design target) |
| App | Live heatmap + force curves + session analysis pages |
| Export | CSV per session (raw + computed parameters) |
| Calibration | Buyer-run body-weight procedure; documented |
| Medical status | Screening/learning aid only — NOT a medical device |
| Output | Live demo, session reports, CSV datasets for analysis |
Project features
- [8-zone pressure sensing] Thin-film force sensors under heel, midfoot, metatarsals and toes capture the plantar pressure distribution at 50 Hz per foot.
- [Live pressure heatmap] The web app renders the foot's pressure map in real time over BLE — the demo centerpiece that makes the project instantly understandable.
- [Force curve recording] Left and right total-force traces are plotted live and stored per session, showing the characteristic double-bump of a normal step.
- [Gait-cycle analysis] The analysis page averages detected steps into heel/midfoot/forefoot pressure-vs-stance curves with loading, mid-stance and push-off bands marked.
- [Symmetry comparison] Peak pressures per zone are compared left vs right as paired bars, with a configurable asymmetry flag threshold for the report.
- [Stride parameters] Cadence, step count, stride length estimate, stance/swing percentage and double-support time are computed per session and exportable as CSV.
- [Calibration procedure] A documented body-weight calibration routine converts raw ADC readings to kilopascals, and the report explains the procedure and its limits honestly.
What is included
- Working sensor insole pair (8 FSR zones per foot, flex cabling, BLE module, battery)
- GaitLab web app source code (live + analysis pages, documented)
- Project report PDF (sensor interfacing, BLE streaming, gait parameters, buyer's walk-test results)
- PPT presentation for final review
- Viva Q&A preparation document (FSR principles, gait cycle biomechanics, BLE, signal processing)
- Calibration and walk-test protocol guide (step-by-step, with data sheet template)
Limitations & prerequisites
- This is an educational screening aid, NOT a medical device: it does not diagnose any condition, and the app and report carry that disclaimer prominently.
- Pressure readings are indicative: FSRs drift with temperature and bending, so the calibration procedure must be followed and results presented with their tolerance.
- Only one insole is fully instrumented in the base kit; the second foot is mirrored in software unless the dual-insole option is ordered.
- WebBluetooth needs Chrome/Edge on desktop or Android; iPhones do not support it — the buyer needs a compatible device for the live demo.
- Battery life covers a demo session, not all-day wear; this is a lab instrument, not a consumer wearable.
- Results vary with shoe fit, socks, walking surface and speed — the protocol guide standardizes the walk test the student reports.
Frequently Asked Questions
Can this diagnose flat feet or other conditions?
No. It shows pressure distribution and symmetry, which a clinician might find interesting, but the project makes no diagnostic claim and must not be presented as one.
How accurate are the pressure readings?
After the body-weight calibration, readings are consistent enough to compare zones and feet within a session. Absolute kilopascal values carry the FSR tolerance the report documents.
Does it need a phone app install?
No — it is a web app using WebBluetooth, so it runs in Chrome/Edge with no install. A phone is not required; a laptop works.
Can I record and compare two sessions?
Yes — each walk test saves as a session with CSV export, so pre/post comparisons (e.g. different footwear) are a natural report experiment.
What if my phone is an iPhone?
iOS browsers do not support WebBluetooth, so use a laptop or Android device for the live demo.
Is this project suitable for a final-year project?
Yes — for Electronics, Instrumentation, Biomedical and IoT programs. It demonstrates sensor interfacing, wireless embedded design, real-time visualization and honest biomechanical measurement. Suitable for B.E./B.Tech final-year projects in Electronics, Instrumentation, Biomedical and IoT Engineering.
Components & software requirements
- 8× FSR-402 thin-film force sensors on flexible insole substrate
- ESP32 BLE microcontroller, LiPo cell with charging module
- GaitLab web app (BLE WebBluetooth, canvas heatmap and charts, CSV export)
- 3D-printed ankle-mount enclosure for electronics (optional wear config)
- Calibration rig procedure (body-weight reference method)
- Session analysis engine (step detection, cycle averaging, symmetry metrics)
Delivery information
Built-to-order project. Delivery timeline is shared after order confirmation based on current queue.
Support terms
Complete documentation, setup guide, and viva preparation included. Support for setup and explanation provided.