
More project photos (2)

The problem
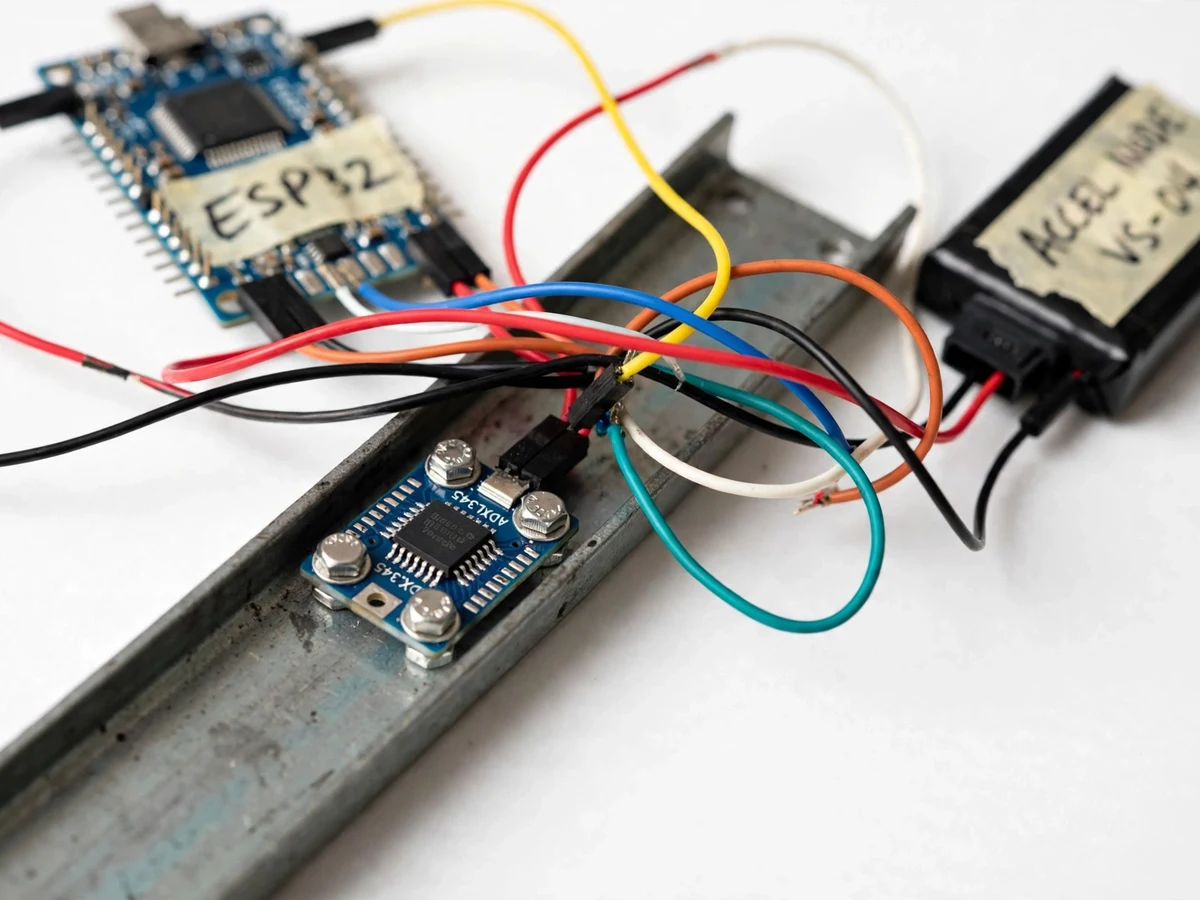
Bridges are inspected visually on schedules, but structural damage — a cracked girder, a loosened bearing — changes how a bridge vibrates long before it is visible. Structural health monitoring (SHM) is the engineering answer: measure the vibration signature, and watch for the modal frequencies drifting as stiffness is lost. Full SHM installations cost lakhs, so students study the theory without ever touching it. This project is a working, classroom-scale SHM loop. An accelerometer node on a model bridge girder samples at 100 Hz and streams to the cloud; the pipeline computes RMS acceleration, runs an FFT, picks the modal peaks, and compares each mode against the design estimate. A 30-day drift chart makes the core SHM principle tangible: healthy structure, flat line; stiffness loss, downward drift past the alert band. The dashboard also logs events — heavy-vehicle passes, wind gusts — so the student learns to separate normal excitation from structural change, which is the actual skill in vibration monitoring.
How it works
- The MPU6050 samples acceleration at 100 Hz; the ESP32 batches and streams the data to the cloud over Wi-Fi.
- The cloud pipeline computes RMS acceleration over rolling 10-minute windows and checks it against the 0.15 g threshold.
- An FFT runs on each data window; peak detection identifies the modal frequencies (bending and torsional modes).
- Measured modes are compared against the design estimates from the bridge model's documented calculation, giving per-mode drift percentages.
- The dashboard renders the live waveform, the FFT spectrum with marked peaks, and the modal comparison table.
- Daily baseline FFTs are stored; the 30-day drift chart plots 1st-mode drift against the ±2% healthy band.
- Drift beyond ±5% (sustained) would raise an inspection alert — the threshold logic is documented for the student's own structure.
Tech stack:
- ESP32 + MPU6050 accelerometer
- 100 Hz sampling firmware
- Cloud ingestion (MQTT/HTTP design)
- FFT spectral analysis
- Time-series storage
- Cloud dashboard (HTML/CSS/JS + canvas charts)
| Parameter | Value |
|---|---|
| Accelerometer | MPU6050, ±2 g range (design) |
| Sampling rate | 100 Hz |
| Modes tracked | 4 (1st/2nd/3rd bending, 1st torsion) |
| Design 1st mode | 4.9 Hz (model estimate, documented) |
| Healthy band | ±2% drift (design) |
| Inspection alert | Sustained drift beyond ±5% (design) |
| RMS alert | 0.15 g over 10-min window (design) |
| Dashboard | Cloud web UI, near-real-time |
Project features
- [100 Hz vibration sampling] MPU6050 accelerometer on ESP32, streaming 3-axis acceleration to the cloud in near real time.
- [Live time-domain view] Scrolling acceleration waveform with RMS computed over 10-minute windows against a 0.15 g alert threshold.
- [FFT spectrum] Frequency-domain view with the dominant modal peaks automatically marked (1st/2nd bending, torsion).
- [Modal comparison table] Measured vs design frequencies per mode with percentage drift and status pills.
- [30-day drift chart] Long-term 1st-mode tracking inside a ±2% healthy band — the damage indicator, demonstrated honestly.
- [Event log] Heavy-vehicle passes, wind gusts and baseline uploads timestamped alongside vibration data.
- [Baseline procedure] Buyer-run method to establish the healthy signature of their own model bridge before drift monitoring begins.
- [Cloud pipeline] Documented path from sensor to dashboard: sampling, transmission, FFT, storage, visualisation.
What is included
- Accelerometer node prototype (ESP32 + MPU6050 on model bridge mount)
- Sampling and streaming firmware
- Cloud dashboard web app (time domain, FFT, modal table, drift chart)
- Cloud pipeline documentation
- Model bridge design notes with modal estimates
- Baseline calibration procedure
- Project report PDF (background, vibration theory, FFT, SHM principles, methodology)
- PPT presentation for final review
- Viva Q&A preparation document (modal analysis, FFT, aliasing, drift as damage indicator)
Limitations & prerequisites
- Built for a model bridge; the modal frequencies are estimates for the model, and the report never claims they represent a real bridge.
- 100 Hz sampling resolves modes up to 50 Hz (Nyquist) — adequate for the model, not for full-scale structures.
- Drift-as-damage is demonstrated as a principle; the demo structure is not actually damaged during the project.
- Wi-Fi streaming needs local network coverage at the installation point.
- Temperature effects on the model (stiffness changes with heat) can mimic drift — the report discusses this confounding factor honestly.
Frequently Asked Questions
What is a modal frequency, in plain terms?
The natural frequencies at which the bridge prefers to vibrate — like the notes of a guitar string. They depend on mass and stiffness, so if the structure loses stiffness (damage), the notes drop. Tracking them is the heart of vibration-based health monitoring.
How does the FFT find these frequencies?
The Fast Fourier Transform converts the time-domain shaking into a spectrum showing how much energy sits at each frequency. The peaks are the modes; the dashboard marks them automatically.
Why track drift over 30 days instead of just measuring once?
One measurement tells you the current state; the trend tells you whether the structure is changing. A slow downward drift past the alert band is the damage signature inspectors look for.
Can this detect actual damage on the model?
The project demonstrates the full detection pipeline on a healthy model and documents the threshold logic. Deliberately damaging the model is listed as an optional student experiment with the expected frequency shift.
What's the difference between RMS alerts and drift alerts?
RMS alerts catch sudden overloads (a heavy vehicle, a gust); drift alerts catch slow structural change. Both are needed, and the dashboard shows both.
Is this project suitable for a final-year project?
Yes — for Electronics and IoT programs, and instrumentation-minded Civil students. It teaches sensors, signal processing, cloud pipelines and a genuine structural-engineering application. Suitable for B.E./B.Tech final-year projects in Electronics and IoT & Embedded Systems.
Components & software requirements
- ESP32 + MPU6050 accelerometer
- 100 Hz sampling firmware
- Cloud ingestion (MQTT/HTTP design)
- FFT spectral analysis
- Time-series storage
- Cloud dashboard (HTML/CSS/JS + canvas charts)
Delivery information
Built-to-order project. Delivery timeline is shared after order confirmation based on current queue.
Support terms
Complete documentation, setup guide, and viva preparation included. Support for setup and explanation provided.