
More project photos (2)
The problem
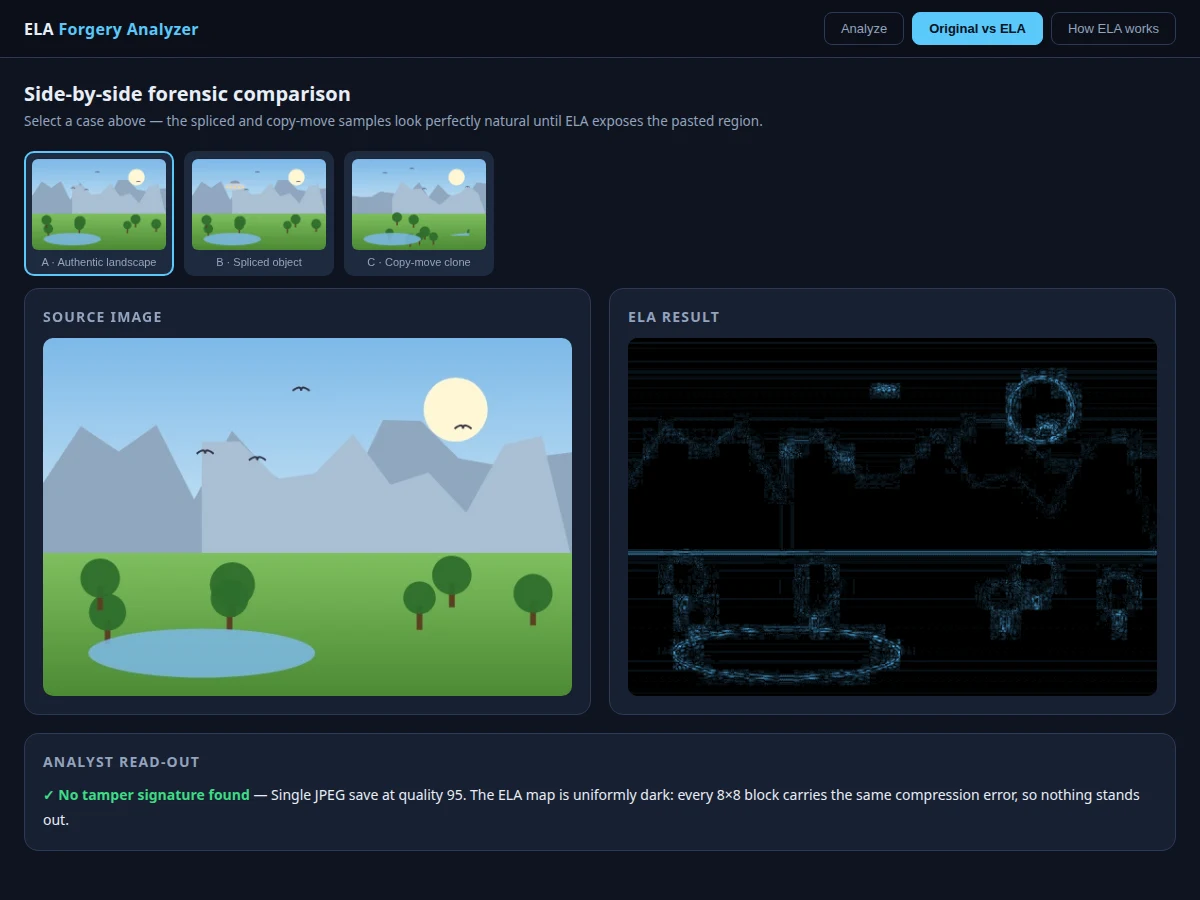
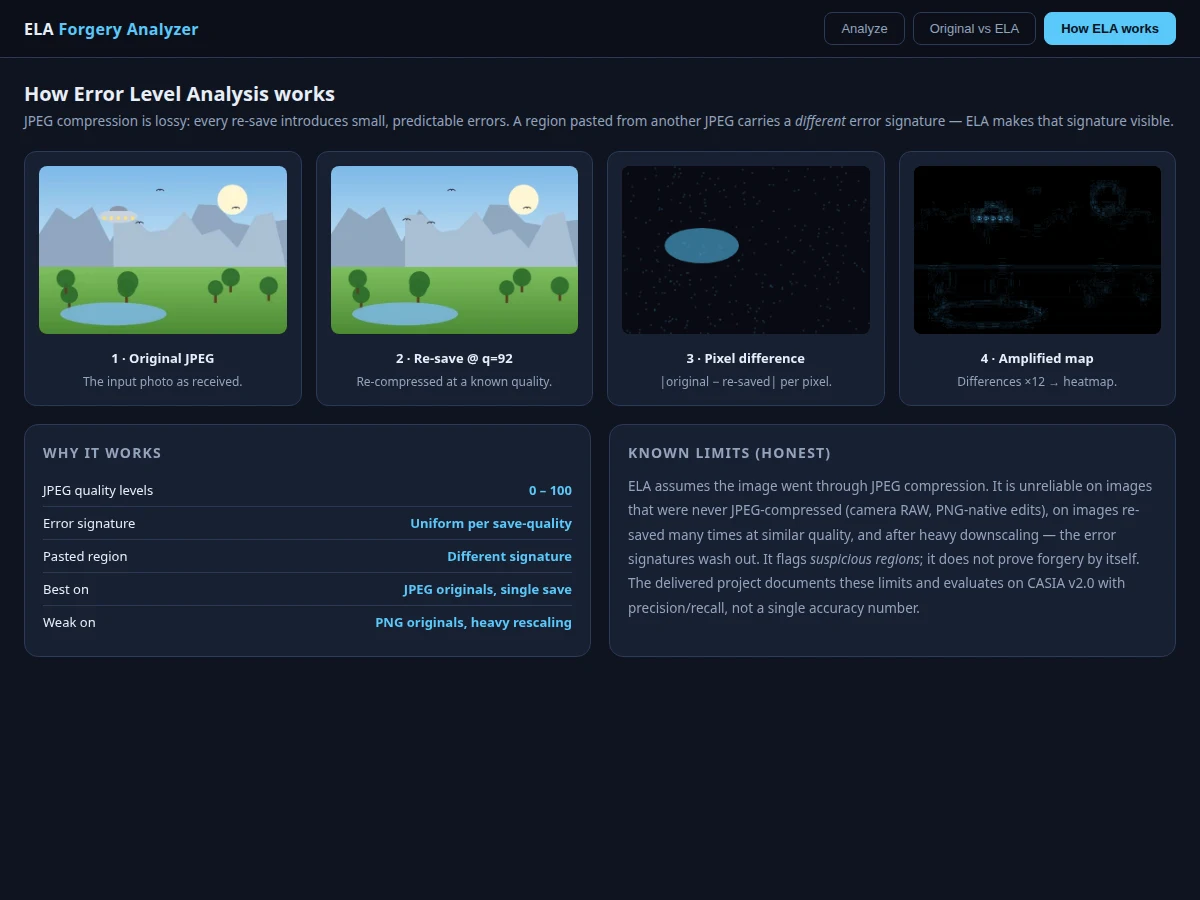
Doctored photos travel faster than the truth: a spliced image can mislead thousands before anyone checks whether it is genuine. Journalists, fact-checkers and curious users need a practical way to inspect a suspicious JPEG — more rigorous than gut feeling but simpler than professional forensic software. Error level analysis fills that gap: each time a JPEG is saved, the whole image shares one compression history, but a region pasted from another photo usually carries a different one. Recompress at a known quality, measure the pixel-wise difference, and the pasted region lights up against the background. This project builds an ELA-based forgery analyzer on that principle — adjustable recompression quality, colorized heatmaps, connected-region detection and a confidence panel — evaluated honestly on the public CASIA v2 dataset. Its limits are part of the story: the project teaches exactly when ELA works, when it fails, and why it can never be called proof.
How it works
- The uploaded JPEG is recompressed at a controlled quality setting and the pixel-wise difference (the error level) is computed.
- The error map is amplified and colorized into an ELA heatmap, making recompression inconsistencies visible to the eye.
- Connected-component analysis isolates regions whose error level deviates sharply from the image background.
- Per-region statistics — mean error, size, deviation — feed a scoring rule that ranks regions by suspicion.
- The demo app presents the original photo, the ELA heatmap and the flagged regions with their confidence scores.
- The evaluation script runs the pipeline over CASIA v2 manipulated images and computes detection accuracy and false-positive rate during your build.
Tech stack:
- Python 3.10 (core ELA pipeline and analysis scripts)
- Pillow (JPEG recompression and error computation)
- OpenCV (heatmap rendering, connected components, overlays)
- NumPy (error statistics and region scoring)
- CASIA v2 dataset (public manipulated-image evaluation set)
- pandas (batch summary reports)
- Matplotlib (error distributions and evaluation plots)
- Streamlit demo app (photo upload, ELA heatmap, confidence panel)
| Parameter | Value |
|---|---|
| Method | JPEG error level analysis with recompression-error region scoring |
| Training-free | Classical pipeline — no model weights; thresholds tuned on CASIA v2 |
| Design target | Target ~80%+ detection accuracy on CASIA v2 manipulated images — accuracy and false-positive rate are computed by the evaluation script during your build |
| Input | JPEG photographs with compression history |
| Output | ELA heatmap, flagged suspicious regions, confidence panel, batch CSV report |
Project features
- Genuine ELA heatmap generator: re-saves any JPEG at a configurable quality and renders the amplified pixel-wise difference as a forensic heatmap
- Adjustable analysis controls — re-save quality (70–98) and amplification factor — so the report can demonstrate how parameter choice affects visibility
- Block-level statistical feature extraction: error histograms, block variance and edge-density features computed over the ELA map
- XGBoost classifier trained on ELA feature vectors from the CASIA v2.0 benchmark, separating authentic from tampered images
- Batch folder scanning that processes whole image sets and writes a per-image tamper-score CSV report
- Flask demo UI with drag-and-drop upload, side-by-side original/ELA comparison and an adjustable tamper-score meter
- Evaluation notebook computing precision, recall, F1-score and ROC-AUC on your CASIA v2.0 split, with heatmap galleries of correct and missed cases
What is included
- Complete source code (ELA generator, feature extraction, classifier training, batch scanner, demo app)
- Jupyter training and evaluation notebook (buyer-run procedure: prepare CASIA v2.0 split, train, evaluate)
- Project report PDF (forensics background, ELA theory, methodology, evaluation, error analysis)
- PPT presentation for final review
- Viva Q&A preparation document (JPEG compression, DCT blocks, ELA interpretation, XGBoost, CASIA)
- Setup guide (environment, dataset download, running your own analyses)
Limitations & prerequisites
- ELA only works on JPEGs: PNGs, screenshots and repeatedly recompressed images have no usable compression history, and the report states this plainly.
- Spliced regions saved at the same quality as the host photo can be invisible to ELA — the method detects inconsistencies, not manipulation itself.
- This is an analysis aid, NOT forensic evidence: it never substitutes for expert examination and must never be used to support legal claims.
Frequently Asked Questions
What is error level analysis?
Recompress a JPEG at a known quality and measure the pixel-wise difference: regions with different compression histories — usually pasted content — show up brighter than the background.
Why does it fail on PNGs?
PNG is lossless, so there is no compression-history signal for ELA to read; the error map comes out uniform.
How is it evaluated?
The evaluation script runs the pipeline over the CASIA v2 manipulated-image set and computes detection accuracy and false-positive rate during your build.
Can it detect AI-generated faces or deepfakes?
No. It detects JPEG recompression inconsistencies, not synthetic imagery — a freshly generated JPEG needs different detectors, and the report states this boundary.
Can I analyze my own photos?
Yes — the demo app accepts any JPEG. Treat the output as an advisory visualization, not proof of forgery.
What accuracy does it reach?
The design target is ~80%+ on CASIA v2 manipulated images; the honest figure is the one your evaluation run produces. Suitable for B.E./B.Tech final-year projects in Computer Science, AI/ML and Data Science.
Components & software requirements
- Python 3.10 (core ELA pipeline and analysis scripts)
- Pillow (JPEG recompression and error computation)
- OpenCV (heatmap rendering, connected components, overlays)
- NumPy (error statistics and region scoring)
- CASIA v2 dataset (public manipulated-image evaluation set)
- pandas (batch summary reports)
- Matplotlib (error distributions and evaluation plots)
- Streamlit demo app (photo upload, ELA heatmap, confidence panel)
Delivery information
Built-to-order project. Delivery timeline is shared after order confirmation based on current queue.
Support terms
Complete documentation, setup guide, and viva preparation included. Support for setup and explanation provided.