
More project photos (2)
The problem
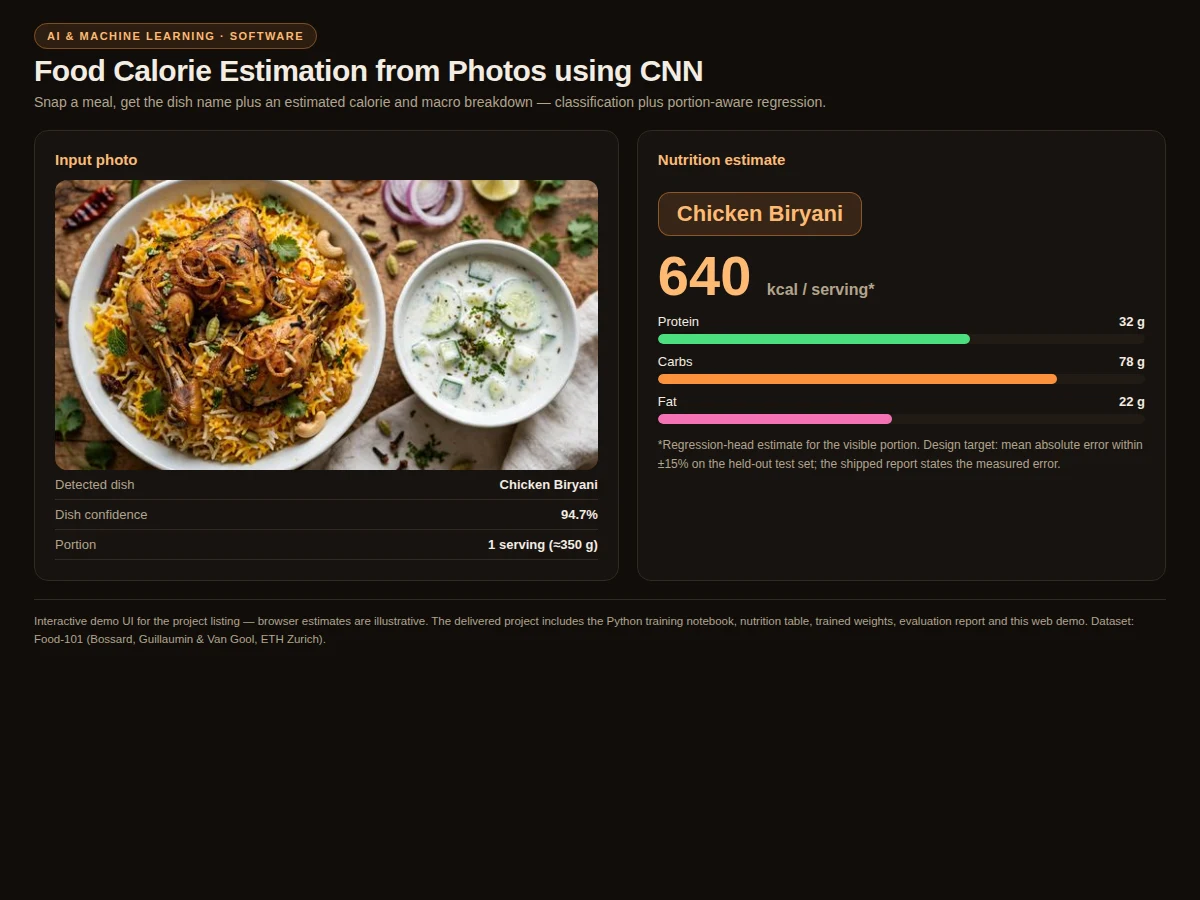
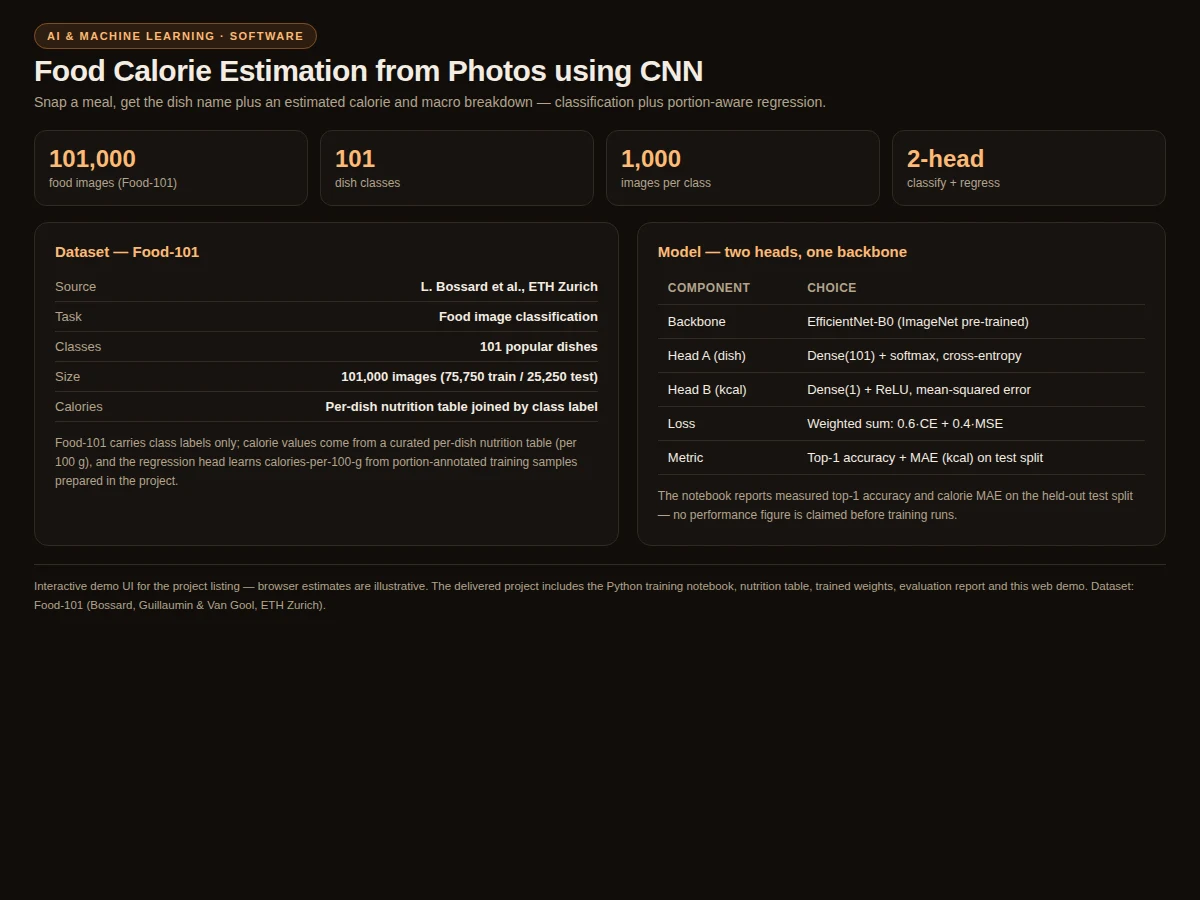
Diet-logging apps fail when every meal must be typed and portion-guessed by hand; photo-based estimation removes that friction. The task splits into two coupled problems: recognizing the dish, and estimating its energy content. The Food-101 dataset (Bossard, Guillaumin and Van Gool, ETH Zurich) gives 101,000 labeled food images across 101 dishes — the standard classification benchmark — while calorie values come from a curated per-dish nutrition table. A shared convolutional backbone with two heads (classification + regression) learns visual features useful to both tasks at once. The honest engineering lives in the error handling: the demo shows dish confidence next to the calorie number, states the measured error band, and never presents the estimate as medical advice.
How it works
- The meal photo is resized to 224x224 and normalized for the EfficientNet-B0 backbone.
- The backbone extracts multi-scale food features — texture, color, shape.
- Head A (Dense(101) + softmax, cross-entropy) predicts the dish; head B (Dense(1) + ReLU, MSE) predicts kcal per 100 g.
- Joint training uses a weighted loss: 0.6 × classification + 0.4 × regression.
- The kcal/100 g output is scaled by the dish reference weight and the user's portion multiplier.
- The nutrition table supplies protein/carbs/fat for the predicted dish; the demo renders the full breakdown.
Tech stack:
- Python 3.10, TensorFlow/Keras or PyTorch
- EfficientNet-B0 (ImageNet pre-trained)
- Food-101 dataset (ETH Zurich)
- Curated per-dish nutrition table
- Flask (demo backend)
- HTML/CSS/JavaScript (demo UI)
- Git
Dataset & Model Details
- Dataset: Food-101 — 101,000 images, 101 dish classes (75,750 train / 25,250 test); source: L. Bossard et al., ETH Zurich. Calorie values from a curated per-dish nutrition table joined by class label; the regression head trains on portion-annotated samples.
- Model input: 224x224x3 image. Outputs: 101-way dish softmax + single kcal/100 g regression value.
- Architecture: EfficientNet-B0 → Head A Dense(101)+softmax → Head B Dense(1)+ReLU; weighted joint loss.
- Metric: dish top-1 accuracy + calorie MAE on the test split, measured after training. Design target: MAE within ±15%; the shipped report states the measured error.
| Parameter | Value |
|---|---|
| Dishes | 101 classes (Food-101) |
| Input | 224x224 meal photo |
| Outputs | Dish + kcal + protein/carbs/fat |
| Portions | 0.5x / 1x / 2x selectable |
| Inference | Under 1 s per photo on CPU (design target) |
| Demo | Photo upload + portion picker |
Project features
- [Two-headed architecture] One EfficientNet-B0 backbone feeds a 101-class dish classifier and a calorie regression head, trained with a weighted joint loss.
- [Portion-aware estimates] The user picks 0.5x/1x/2x servings; the regression head's per-100-g output scales to the serving.
- [Macro breakdown] Protein, carbs and fat computed from the per-dish nutrition table for the predicted dish.
- [Confidence-transparent UI] Dish confidence displayed next to the calorie figure, so uncertain classifications are visible, not hidden.
- [Curated nutrition table] Per-100-g values for all 101 dishes ships with the project and is editable.
- [Measured error band] Calorie MAE reported from the held-out test split — the report states the band plainly.
- [Viva-ready documentation] Report, PPT and Q&A covering multi-task learning, regression metrics and honest failure modes.
What is included
- Python training notebook (two-head training, joint loss, evaluation)
- Curated per-dish nutrition table (editable)
- Trained model weights
- Test-split evaluation: top-1 accuracy + calorie MAE from the actual run
- Web demo (photo upload, portion picker, macro breakdown)
- Project report PDF (methodology, error analysis, limitations)
- PPT presentation for final review
- Viva Q&A preparation document
Limitations & prerequisites
- Estimates are approximate: hidden oil, sauces and true portion size are the biggest error sources.
- Mixed plates (thali with 5 items) are read as the dominant dish; multi-dish segmentation is future scope.
- This is a diet-logging aid, explicitly not medical or clinical nutrition advice.
- Dishes outside the 101 Food-101 classes get the closest match, which may be wrong — confidence display mitigates this.
- Fine-tuning benefits from a GPU; CPU training is possible but slow on 101k images.
Frequently Asked Questions
Where do the calorie numbers come from?
Food-101 provides dish labels only. A curated per-dish nutrition table (kcal/protein/carbs/fat per 100 g) ships with the project, and the regression head learns kcal-per-100-g from portion-annotated training samples.
How accurate are the estimates?
The notebook measures calorie MAE on the held-out test split; the design target is within ±15%, and the report states the measured band honestly, including failure cases like occluded portions.
Can it handle a full thali with many items?
Not yet — it predicts the dominant dish. Multi-dish segmentation is documented as future scope.
Is this medical advice?
No. The listing and the demo both state it is a diet-logging aid with an approximate error band, not clinical nutrition guidance.
Do I need a GPU?
Recommended for training on 101k images; inference and the demo run fine on CPU.
Is this project suitable for a final-year project?
Yes — for Computer Science, IT and AI/ML programs. It combines classification, regression, multi-task learning and honest error analysis on a real benchmark. Suitable for B.E./B.Tech final-year projects in Computer Science, Information Technology and AI/ML.
Components & software requirements
- Python 3.10, TensorFlow/Keras or PyTorch
- EfficientNet-B0 (ImageNet pre-trained)
- Food-101 dataset (ETH Zurich)
- Curated per-dish nutrition table
- Flask (demo backend)
- HTML/CSS/JavaScript (demo UI)
- Git
Dataset & Model Details
- Dataset: Food-101 — 101,000 images, 101 dish classes (75,750 train / 25,250 test); source: L. Bossard et al., ETH Zurich. Calorie values from a curated per-dish nutrition table joined by class label; the regression head trains on portion-annotated samples.
- Model input: 224x224x3 image. Outputs: 101-way dish softmax + single kcal/100 g regression value.
- Architecture: EfficientNet-B0 → Head A Dense(101)+softmax → Head B Dense(1)+ReLU; weighted joint loss.
- Metric: dish top-1 accuracy + calorie MAE on the test split, measured after training. Design target: MAE within ±15%; the shipped report states the measured error.
Delivery information
Built-to-order project. Delivery timeline is shared after order confirmation based on current queue.
Support terms
Complete documentation, setup guide, and viva preparation included. Support for setup and explanation provided.