
More project photos (2)
The problem
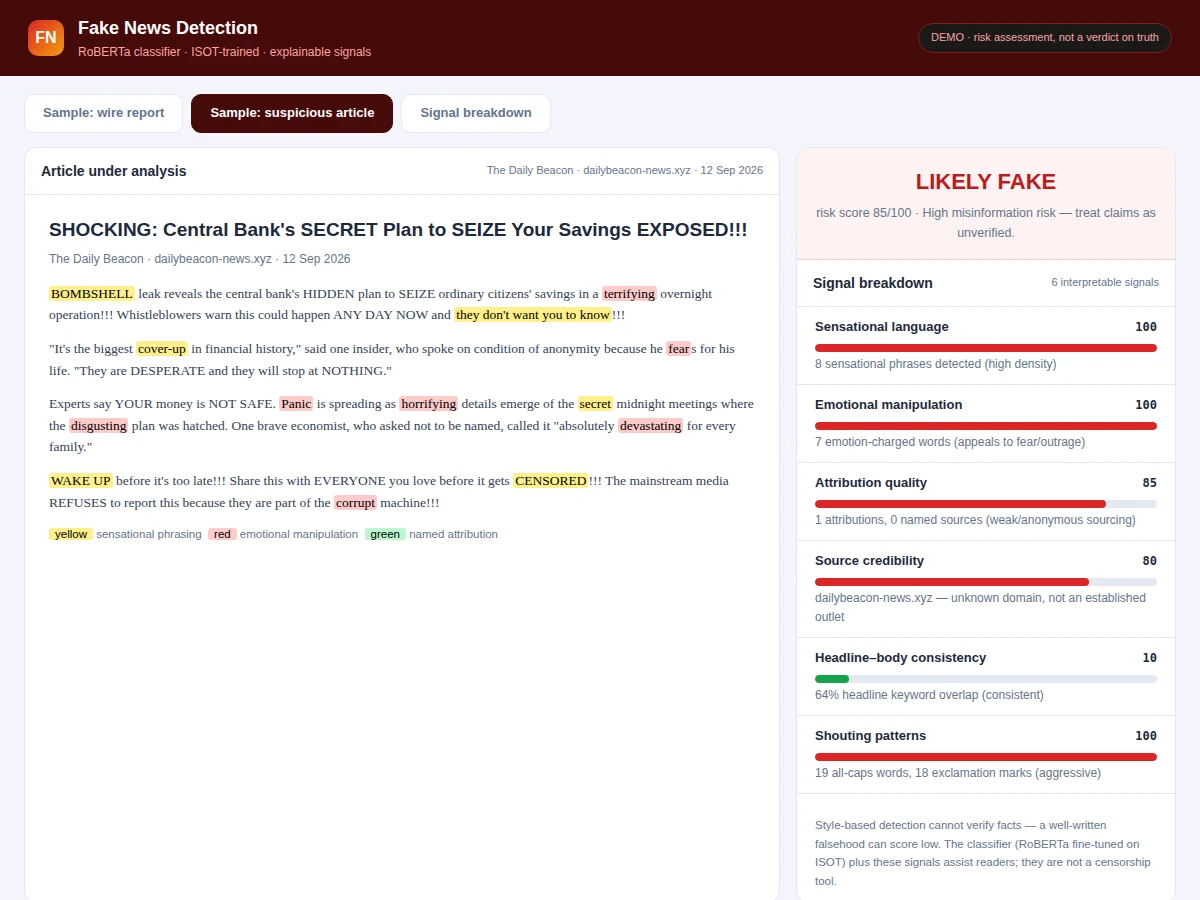
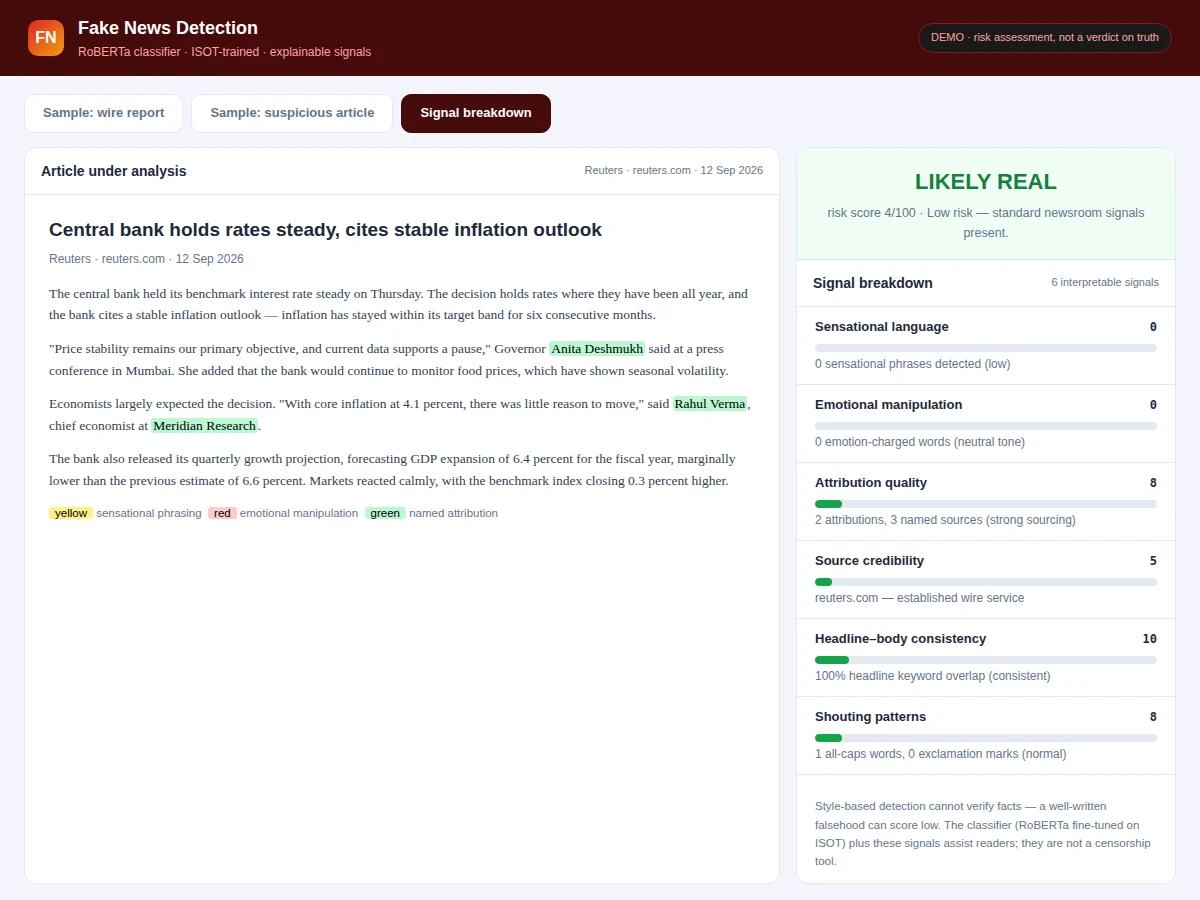
Misinformation spreads faster than fact-checks can follow, and readers have no reliable way to judge an unfamiliar article in the moment. Automated detection is genuinely hard — style alone does not prove falsehood — which is exactly why this project is built with unusual honesty about its limits. A RoBERTa classifier fine-tuned on the ISOT dataset (44,898 labeled real and fake news articles) learns the stylistic fingerprints of fabricated news, and a transparent signal layer scores interpretable factors: sensational vocabulary density, emotional manipulation markers, attribution presence (named sources vs "experts say"), and headline–body consistency. The demo never claims certainty — it presents a risk assessment with the evidence, like a spell-checker for credibility. The report documents where the model fails (well-written disinformation, satire) as carefully as where it succeeds.
How it works
- Article text is cleaned and split into headline and body; the publishing source is extracted when available.
- RoBERTa-base, fine-tuned on ISOT, outputs a fake-vs-real probability from the full article text.
- In parallel, six rule-based signals are computed: sensational word density, emotion-lexicon hits, named-source attribution count, source-list match, headline–body semantic similarity, and capitalization patterns.
- The classifier probability and signal scores are combined with documented weights into a final risk band: likely real, uncertain, or likely fake.
- The demo renders the verdict card with per-signal bars and highlights the contributing phrases in the article text.
- Evaluation on ISOT's held-out split reports accuracy, precision/recall and F1 honestly, with an error analysis of satire and well-written fakes in the report.
Tech stack:
- Python 3.11, Hugging Face Transformers
- RoBERTa-base (roberta-base) fine-tuned on ISOT
- ISOT Fake News Dataset (44,898 articles)
- PyTorch (fine-tuning)
- scikit-learn (metrics)
- spaCy (linguistic features)
- Flask + HTML/CSS/JS (demo)
Dataset & model details
- Dataset: ISOT Fake News Dataset (Ahmed et al., 2017) — 44,898 full-text articles: 21,417 real (Reuters) and 23,481 fake, collected 2016–2017. The standard public benchmark for fake-news text classification. Source: the authors' release (widely mirrored, e.g. Kaggle "Fake News").
- Task: Binary classification — input = news article text (+ source), output = real/fake probability plus six interpretable signal scores.
- Model: RoBERTa-base (125M parameters) fine-tuned on ISOT; signal layer uses lexicon and pattern features documented in the report.
- Metrics: Accuracy, precision, recall and F1 on ISOT's held-out split — reported as design targets from the training run, never pre-claimed.
| Parameter | Value |
|---|---|
| Articles | 44,898 (21,417 real / 23,481 fake) |
| Signals | 6 interpretable linguistic signals |
| Model | RoBERTa-base fine-tune, ~125M parameters |
| F1 | Design target on held-out split (reported after training) |
| Demo latency | Under 3 s per article on CPU (expected) |
| Demo | Single-file web app with preloaded samples |
| Fine-tuning | Approximately 2–4 h on a single GPU (expected) |
Project features
- [RoBERTa classifier] RoBERTa-base fine-tuned on the ISOT Fake News dataset distinguishes real from fabricated articles by learned stylistic patterns.
- [Explainable signal layer] Six transparent signals — sensationalism, emotional manipulation, attribution quality, source credibility, headline–body consistency, all-caps density — each scored and shown.
- [Verdict card] Every analysis renders as a risk card: likely-real / uncertain / likely-fake with confidence and the top contributing signals.
- [Signal highlighting] The demo highlights the exact words and phrases driving each signal inside the article text.
- [Source credibility check] The publishing domain is checked against a documented list of known unreliable outlets and satire sites.
- [Uncertainty honesty] Borderline articles get an "uncertain — verify manually" verdict with fact-checking guidance instead of a forced classification.
- [Live web demo] Paste any article or analyze the preloaded real and fake samples; the full signal breakdown computes instantly.
What is included
- Fine-tuned RoBERTa fake-news classifier
- Signal-analysis pipeline source (6 documented signals)
- Source credibility reference list (documented)
- Web demo with preloaded real and fake sample articles
- Evaluation notebook (accuracy, F1, error analysis on satire)
- Project report PDF (background, transformers, misinformation detection limits, results)
- PPT presentation for final review
- Viva Q&A preparation document (RoBERTa, ISOT, precision/recall, adversarial limits)
Limitations & prerequisites
- Style-based detection cannot verify facts — a well-written false article can pass, and the report's error analysis documents this openly.
- ISOT articles are from 2016–2017; news style and topics have shifted, so the demo includes a dataset-age discussion.
- Satire sites are flagged by the source list, not understood as humor — satire is an explicit known-failure case.
- F1 is a design target until the training run executes; the report records the achieved figure.
- The tool assists readers; it is not a content-moderation system and must not be used to auto-censor.
Frequently Asked Questions
Which dataset is used?
The ISOT Fake News Dataset — nearly 45,000 full-text articles, half real (Reuters) and half fake, from 2016–2017. It is the standard public benchmark for this task.
Can it really tell true from false?
Honestly: it detects the stylistic fingerprints of fabricated news, not factual truth. The project is explicit that style-based detection has real limits — well-written disinformation can fool it, and the report documents these failures.
What signals does it show?
Sensationalism, emotional manipulation, attribution quality, source credibility, headline–body consistency and capitalization patterns — each scored and with the driving phrases highlighted in the text.
What happens with borderline articles?
They get an "uncertain" verdict with fact-checking guidance (check the source, search the claim, look for corroboration) instead of a forced real/fake label.
Isn't this a censorship tool?
No — it is a reader-assistance demo that explains its reasoning. The report states it must not be used for automated content removal.
Is this project suitable for a final-year project?
Yes — for Computer Science, IT and AI/ML programs. It is transformer text classification on a real benchmark, built with rare honesty about what the model can and cannot do. Suitable for B.E./B.Tech final-year projects in Computer Science, IT and AI & Machine Learning.
Components & software requirements
- Python 3.11, Hugging Face Transformers
- RoBERTa-base (roberta-base) fine-tuned on ISOT
- ISOT Fake News Dataset (44,898 articles)
- PyTorch (fine-tuning)
- scikit-learn (metrics)
- spaCy (linguistic features)
- Flask + HTML/CSS/JS (demo)
Dataset & model details
- Dataset: ISOT Fake News Dataset (Ahmed et al., 2017) — 44,898 full-text articles: 21,417 real (Reuters) and 23,481 fake, collected 2016–2017. The standard public benchmark for fake-news text classification. Source: the authors' release (widely mirrored, e.g. Kaggle "Fake News").
- Task: Binary classification — input = news article text (+ source), output = real/fake probability plus six interpretable signal scores.
- Model: RoBERTa-base (125M parameters) fine-tuned on ISOT; signal layer uses lexicon and pattern features documented in the report.
- Metrics: Accuracy, precision, recall and F1 on ISOT's held-out split — reported as design targets from the training run, never pre-claimed.
Delivery information
Built-to-order project. Delivery timeline is shared after order confirmation based on current queue.
Support terms
Complete documentation, setup guide, and viva preparation included. Support for setup and explanation provided.