
More project photos (2)

The problem
Replacing an employee costs a company several months of that employee's salary in hiring and ramp-up, yet most HR teams spot flight risks only at the resignation meeting. The IBM HR Analytics dataset — 1,470 employee records with 35 features covering satisfaction, income, overtime, tenure and work-life balance — is the standard teaching dataset for this problem, and it is honest about real-world difficulty: only ~16% of employees left, so a lazy model can score 84% by predicting "stays" for everyone. This project does the pipeline properly: one-hot encoding of categoricals, SMOTE balancing on the training fold, stratified evaluation of four classifiers with precision/recall/F1 (not just accuracy), and gain-based feature importance. A web demo turns the trained XGBoost model into an interactive HR tool — enter a profile, get the attrition probability, see the drivers, and read retention suggestions.
How it works
- The IBM HR Analytics dataset (1,470 rows × 35 columns) is loaded; constant columns (EmployeeCount, StandardHours, Over18) are dropped and categoricals one-hot encoded.
- The data is split with stratification (80/20); the training fold is balanced with SMOTE since only ~16% of records are attrition cases.
- XGBoost, LightGBM, random forest and logistic regression train with cross-validated hyperparameters on the identical splits.
- Models are compared on the held-out test set using accuracy, precision, recall, F1 and ROC-AUC; XGBoost is selected on F1 for the imbalanced target.
- Gain-based feature importance is computed and the final pipeline is serialized.
- In the web demo, an entered profile flows through the identical encoding pipeline and the app renders the attrition probability, risk band, top drivers and retention suggestions.
Tech stack:
- Python 3, scikit-learn
- XGBoost, LightGBM (gradient boosting)
- Pandas, NumPy (data handling)
- Matplotlib, Seaborn (EDA plots)
- imbalanced-learn SMOTE
- Jupyter Notebook (training)
- HTML/CSS/JavaScript (web demo)
- IBM HR Analytics dataset (Kaggle)
Dataset & model details
- Dataset: IBM HR Analytics Employee Attrition & Performance — Kaggle (fictional dataset created by IBM data scientists for HR analytics practice). 1,470 employees × 35 columns (numeric + categorical); target Attrition = Yes ≈ 16% / No ≈ 84%.
- Task: Binary classification; input = encoded employee profile (demographics, role, compensation, satisfaction, tenure), output = probability of attrition.
- Model: XGBoost (selected) after comparing LightGBM, random forest and logistic regression; pipeline = one-hot encoding → SMOTE (train fold) → gradient boosting.
- Metrics: Test accuracy (design target ≈ 86%), precision/recall/F1 on the attrition class, ROC-AUC. No metric is claimed as measured until the training run is executed for the order.
| Parameter | Value |
|---|---|
| Input | ~30 encoded HR features per employee |
| Records | 1,470 (attrition ≈ 16% — imbalanced) |
| Test accuracy | ≈ 86% (design target, not a measured claim) |
| F1 (attrition class) | ≈ 0.60 (design target) |
| Training time | Under 5 minutes on a laptop CPU (expected) |
| Inference | Under 10 ms per profile (expected) |
| Model file | Under 2 MB serialized pipeline (expected) |
| Demo | Single-file web app, runs offline after download |
Project features
- [Attrition prediction web demo] Enter age, department, role, income, overtime, satisfaction scores and tenure; get a live attrition probability with a stay/risk band.
- [Risk-driver breakdown] Each prediction lists the top contributing factors with signed weights, so HR can see why this employee is flagged.
- [Retention suggestions] Rule-based recommendations (overtime review, stay interview, compensation benchmarking) generated from the flagged drivers.
- [Full training notebook] Encoding, scaling, SMOTE, stratified splits and model training in one reproducible Jupyter notebook.
- [Four-model comparison] XGBoost, LightGBM, random forest and logistic regression evaluated on identical splits with accuracy, precision, recall, F1 and AUC.
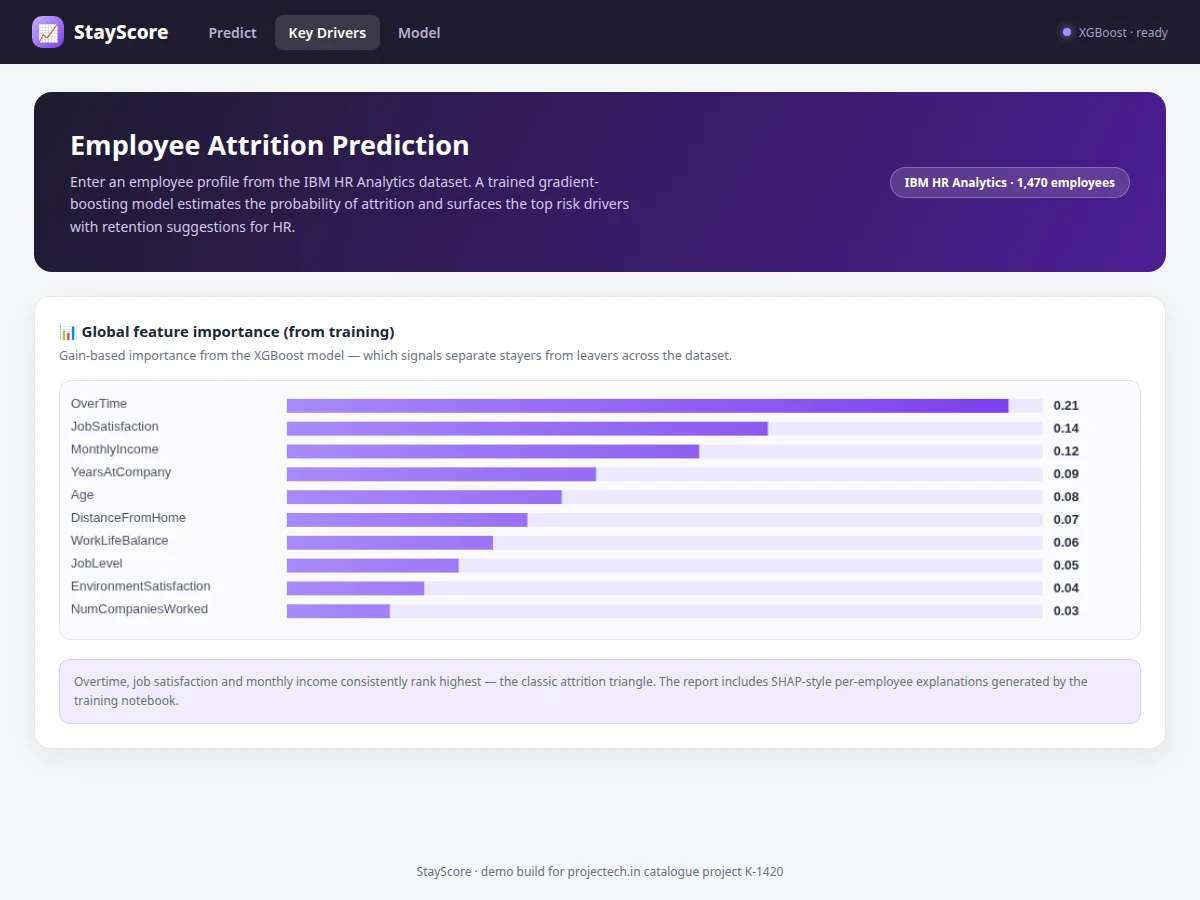
- [Feature importance analysis] Gain-based importance chart plus per-employee explanation examples for the report.
- [Exported trained model] Serialized pipeline (encoder + model) so the demo scores with the real trained classifier.
What is included
- Complete training & evaluation Jupyter notebook (EDA, encoding, SMOTE, model comparison)
- Trained XGBoost pipeline file
- Interactive attrition-prediction web demo with driver explanations
- EDA plots, ROC curves, feature-importance charts
- Project report PDF (background, HR context, methodology, results, ethics note)
- PPT presentation for final review
- Viva Q&A preparation document (gradient boosting, imbalance, precision/recall, encoding)
Limitations & prerequisites
- HR decision-support demonstration for education — it must never drive real employment decisions, and the report states this explicitly.
- The dataset is fictional (created by IBM data scientists); patterns learned are illustrative, not labor-market facts.
- ≈ 86% accuracy is a design target for the training run, stated honestly — the report documents the actual achieved figures after training.
- With only ~16% positive cases, false positives are expected; the report discusses the precision/recall trade-off openly.
- Retention suggestions are heuristic rules, not management advice.
Frequently Asked Questions
Which dataset is used and why?
The IBM HR Analytics Employee Attrition dataset on Kaggle — 1,470 employees with 35 HR features. It is the standard benchmark for this task and its 16% attrition rate forces honest handling of class imbalance.
Why not just predict "stays" for everyone?
That scores 84% accuracy and teaches nothing. The project optimizes F1 on the attrition class instead, and the report shows why accuracy alone is misleading on imbalanced data — a classic viva question.
How does the web demo compute the risk?
Your entered profile passes through the exact training encoding pipeline into the trained XGBoost model; the app shows the attrition probability, the top weighted drivers and retention suggestions for the flagged factors.
Which factors matter most?
Overtime, job satisfaction and monthly income consistently rank highest — the classic attrition triangle — followed by years at company and age. The feature-importance chart in the report quantifies this.
Can this be used for real HR decisions?
No — the dataset is fictional and the project is educational. The report carries an explicit ethics note against using attrition models for employment decisions without consent and oversight.
Is this project suitable for a final-year project?
Yes — for Computer Science, IT and AI/ML programs. It covers categorical encoding, imbalance handling, boosting models, evaluation discipline and an interactive deployment. Suitable for B.E./B.Tech final-year projects in Computer Science, IT and AI & Machine Learning.
Components & software requirements
- Python 3, scikit-learn
- XGBoost, LightGBM (gradient boosting)
- Pandas, NumPy (data handling)
- Matplotlib, Seaborn (EDA plots)
- imbalanced-learn SMOTE
- Jupyter Notebook (training)
- HTML/CSS/JavaScript (web demo)
- IBM HR Analytics dataset (Kaggle)
Dataset & model details
- Dataset: IBM HR Analytics Employee Attrition & Performance — Kaggle (fictional dataset created by IBM data scientists for HR analytics practice). 1,470 employees × 35 columns (numeric + categorical); target Attrition = Yes ≈ 16% / No ≈ 84%.
- Task: Binary classification; input = encoded employee profile (demographics, role, compensation, satisfaction, tenure), output = probability of attrition.
- Model: XGBoost (selected) after comparing LightGBM, random forest and logistic regression; pipeline = one-hot encoding → SMOTE (train fold) → gradient boosting.
- Metrics: Test accuracy (design target ≈ 86%), precision/recall/F1 on the attrition class, ROC-AUC. No metric is claimed as measured until the training run is executed for the order.
Delivery information
Built-to-order project. Delivery timeline is shared after order confirmation based on current queue.
Support terms
Complete documentation, setup guide, and viva preparation included. Support for setup and explanation provided.