
More project photos (2)
The problem
Automated arrhythmia detection is one of the most cited applications of deep learning in biomedical signal processing: millions of ECG beats are recorded by Holter monitors every day, and cardiologists cannot review all of them by hand. The MIT-BIH Arrhythmia Database is the standard benchmark for this task — 48 half-hour ambulatory recordings with over 100,000 expert-annotated beats. This project builds the full pipeline the literature uses: raw ECG is cleaned and segmented around detected R-peaks with the classical Pan-Tompkins QRS detector, each beat window is fed to a 1D CNN, and the network outputs one of the five AAMI beat classes. A live web demo makes the pipeline tangible — real MIT-BIH signal streams through the actual preprocessing and QRS-detection code while heart rate, rhythm status and beat measurements update in real time. Because the demo is explicit about what is real signal processing and what the trained CNN adds, the student can defend every stage in the viva.
How it works
- MIT-BIH records are loaded at 360 Hz; baseline wander is removed and the signal is band-passed as the front-end of the Pan-Tompkins QRS detector.
- The detector (bandpass → derivative → squaring → 150 ms moving-window integration) locates R-peaks, and a 216-sample window is cut around each peak.
- Beats are labeled into the five AAMI classes (N, S, V, F, Q) from the database annotations and split by patient (DS1 train / DS2 test).
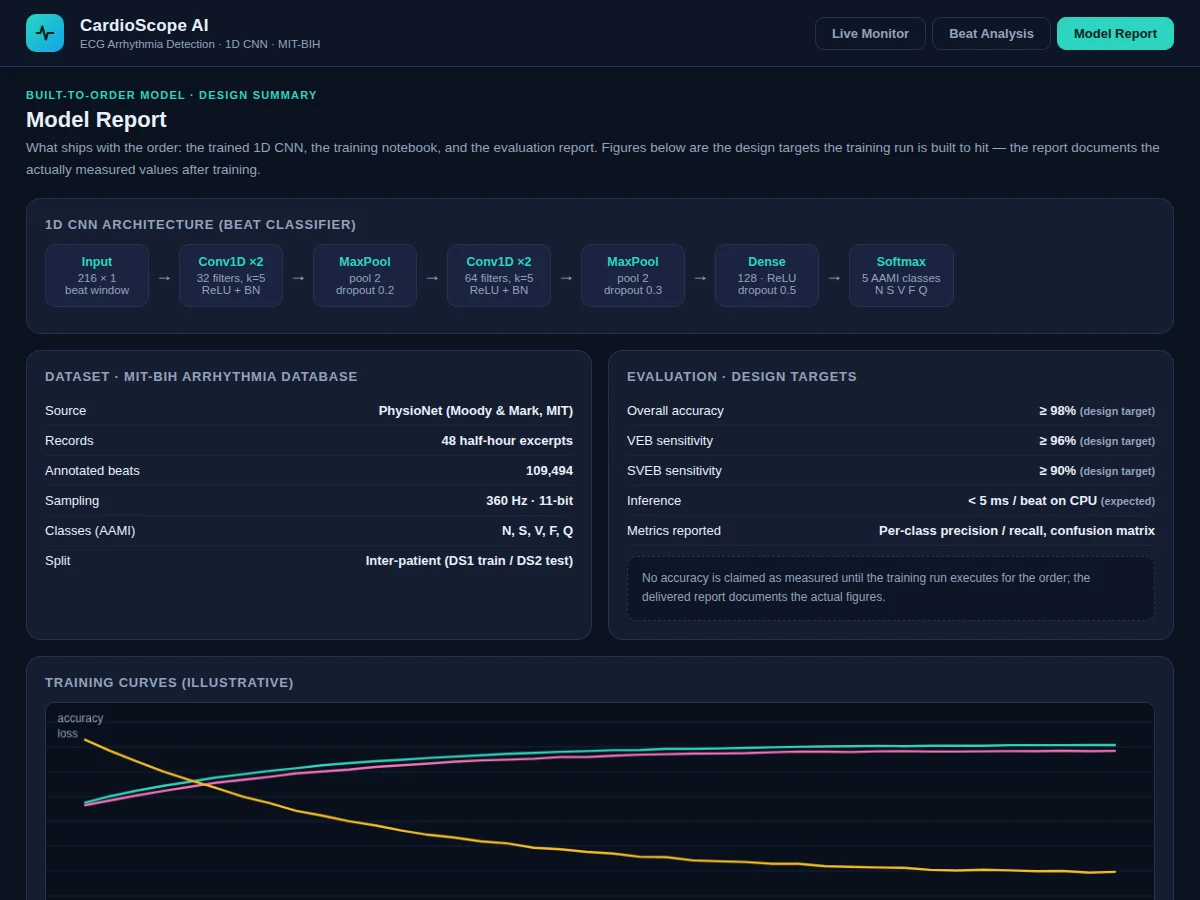
- The 1D CNN — Conv1D(32)×2 → MaxPool → Conv1D(64)×2 → MaxPool → Dense(128) → Softmax(5) — is trained with class weighting to handle the heavy imbalance toward normal beats.
- The held-out patient set is evaluated once: overall accuracy, per-class precision/recall, VEB and SVEB sensitivities and the confusion matrix are generated for the report.
- In the web demo, the same preprocessing and QRS code runs live on streaming MIT-BIH signal; detected beat windows are what the trained CNN classifies in the delivered system.
Tech stack:
- Python 3, TensorFlow/Keras
- NumPy, SciPy, Matplotlib, scikit-learn (metrics)
- Jupyter Notebook (training & evaluation)
- HTML5 canvas + JavaScript (live ECG demo)
- MIT-BIH Arrhythmia Database via PhysioNet
Dataset & model details
- Dataset: MIT-BIH Arrhythmia Database (Moody & Mark, MIT; via PhysioNet) — 48 half-hour excerpts of two-channel ambulatory ECG, 109,494 expert-annotated beats, sampled at 360 Hz with 11-bit resolution.
- Task: Beat-level classification; input = 216×1 ECG window centered on the R-peak, output = probability distribution over the 5 AAMI classes (N: normal, S: supraventricular ectopic, V: ventricular ectopic, F: fusion, Q: unknown).
- Model: 1D CNN: Input(216×1) → Conv1D(32, k=5, ReLU)×2 + BatchNorm → MaxPool(2) + Dropout(0.2) → Conv1D(64, k=5, ReLU)×2 + BatchNorm → MaxPool(2) + Dropout(0.3) → Dense(128, ReLU) + Dropout(0.5) → Dense(5, softmax).
- Metrics: Overall accuracy ≥ 98% (design target), VEB sensitivity ≥ 96% (design target), SVEB sensitivity ≥ 90% (design target), per-class precision/recall/F1, confusion matrix, all on the inter-patient test split. No metric is claimed as measured until the training run executes for the order.
| Parameter | Value |
|---|---|
| Input format | 216 × 1 ECG window at 360 Hz, centered on R-peak |
| Classes | 5 (AAMI: N, S, V, F, Q) |
| QRS detector | Pan–Tompkins (bandpass → derivative → square → 150 ms integration) |
| Overall accuracy | ≥ 98% (design target, not a measured claim) |
| VEB / SVEB sensitivity | ≥ 96% / ≥ 90% (design targets) |
| Inference | < 5 ms per beat on CPU (expected) |
| Training time | Approximately 30–60 min on a laptop CPU/GPU (expected) |
| Demo | Single-file web app; streams real MIT-BIH excerpts |
Project features
- [1D CNN beat classifier] Two Conv1D blocks (32 and 64 filters, kernel 5, batch normalization) with max-pooling and dropout, ending in a 128-unit dense layer and 5-way softmax over the AAMI classes — architecture documented layer by layer.
- [Live ECG monitor demo] Real MIT-BIH signal (360 Hz) streams through the project's actual Pan-Tompkins QRS detector; R-peaks are marked live and heart rate is computed beat-to-beat.
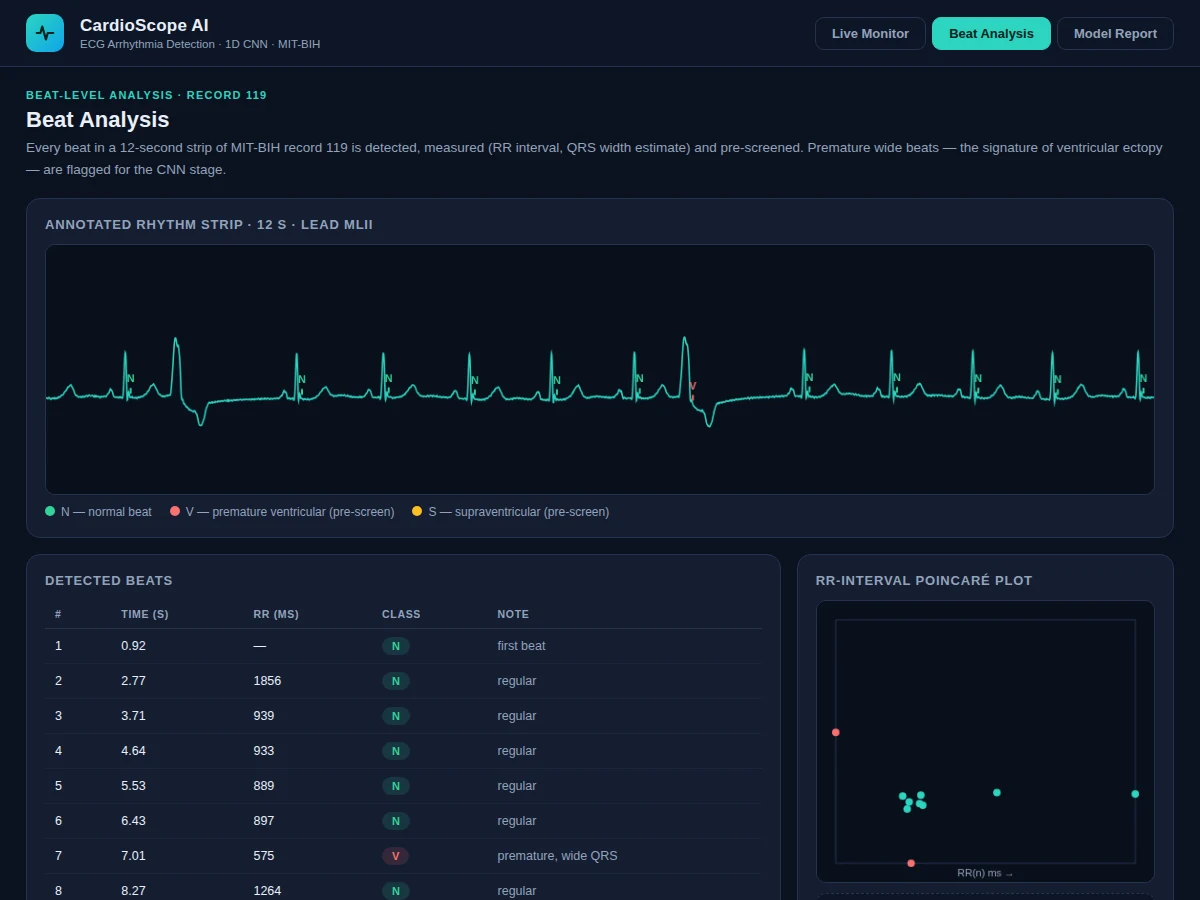
- [Beat analysis view] Every beat in a 12-second strip is detected, measured (RR interval, QRS width estimate) and pre-screened, with a table, an annotated rhythm strip and an RR-interval Poincaré plot.
- [Inter-patient evaluation] Training on one patient set and testing on a disjoint patient set (the DS1/DS2 protocol), so reported performance reflects generalization to new patients, not memorization.
- [Full training notebook] Data loading, beat segmentation, augmentation, model definition, training loop and evaluation in one reproducible Jupyter notebook.
- [Per-class metrics] Precision, recall and F1 for each AAMI class plus the confusion matrix, so the viva can discuss exactly which arrhythmias confuse the model.
- [Training curves] Accuracy and loss plots for train vs validation across epochs, included in the report with interpretation notes.
What is included
- Complete training & evaluation Jupyter notebook (inter-patient protocol)
- Trained 1D CNN model file with preprocessing and QRS-detection code
- Live ECG monitor + beat analysis + model report web demo
- Confusion matrix, per-class metrics and training-curve plots
- Project report PDF (background, signal-processing theory, architecture rationale, methodology, results)
- PPT presentation for final review
- Viva Q&A preparation document (Pan-Tompkins, 1D convolutions, class imbalance, AAMI classes)
Limitations & prerequisites
- MIT-BIH is a 1970s–80s ambulatory dataset — it does not represent modern 12-lead clinical ECG or all populations; the report states this scope limit.
- The demo's on-screen beat labels are a transparent rule-based pre-screen, not the CNN output — the report and demo both say this explicitly.
- ≥98% accuracy and the sensitivity figures are design targets for the training run, stated honestly — the report documents the actual achieved figures after training.
- The project is an educational prototype, not a medical device: it must not be used for real diagnosis or clinical decisions.
- Real-time performance assumes a clean single-lead signal; heavy motion artifacts or paced rhythms are out of scope.
Frequently Asked Questions
Which dataset is used and why?
The MIT-BIH Arrhythmia Database — 48 annotated ambulatory ECG records with 109,494 labeled beats, distributed by PhysioNet. It is the standard benchmark for arrhythmia detection, so every result is comparable with published literature.
Why an inter-patient split?
Splitting by beat leaks patient-specific morphology into the test set and inflates accuracy. The DS1/DS2 inter-patient protocol trains and tests on disjoint patients, so the metrics reflect performance on genuinely new patients.
What does the live demo actually run?
The real preprocessing and Pan-Tompkins QRS-detection code on genuine MIT-BIH signal, with live R-peak marking, heart-rate computation and beat measurements. The trained CNN classification stage ships with the order and is described in the model report view.
Which arrhythmias are hardest to classify?
Typically supraventricular ectopic (S) beats, which morphologically resemble normal beats, and the rare fusion (F) class with very few training examples. The per-class report quantifies this and it makes a strong viva discussion.
Can this be used on real patients?
No. It is an educational prototype for coursework — not a certified medical device, and the report states this limitation explicitly.
Is this project suitable for a final-year project?
Yes — for AI/ML, Electronics/E&TC and biomedical-oriented programs. It demonstrates signal processing, 1D CNN design, rigorous inter-patient evaluation and a working live demo. Suitable for B.E./B.Tech final-year projects in AI & Machine Learning, Electronics and Biomedical-related programs.
Components & software requirements
- Python 3, TensorFlow/Keras
- NumPy, SciPy, Matplotlib, scikit-learn (metrics)
- Jupyter Notebook (training & evaluation)
- HTML5 canvas + JavaScript (live ECG demo)
- MIT-BIH Arrhythmia Database via PhysioNet
Dataset & model details
- Dataset: MIT-BIH Arrhythmia Database (Moody & Mark, MIT; via PhysioNet) — 48 half-hour excerpts of two-channel ambulatory ECG, 109,494 expert-annotated beats, sampled at 360 Hz with 11-bit resolution.
- Task: Beat-level classification; input = 216×1 ECG window centered on the R-peak, output = probability distribution over the 5 AAMI classes (N: normal, S: supraventricular ectopic, V: ventricular ectopic, F: fusion, Q: unknown).
- Model: 1D CNN: Input(216×1) → Conv1D(32, k=5, ReLU)×2 + BatchNorm → MaxPool(2) + Dropout(0.2) → Conv1D(64, k=5, ReLU)×2 + BatchNorm → MaxPool(2) + Dropout(0.3) → Dense(128, ReLU) + Dropout(0.5) → Dense(5, softmax).
- Metrics: Overall accuracy ≥ 98% (design target), VEB sensitivity ≥ 96% (design target), SVEB sensitivity ≥ 90% (design target), per-class precision/recall/F1, confusion matrix, all on the inter-patient test split. No metric is claimed as measured until the training run executes for the order.
Delivery information
Built-to-order project. Delivery timeline is shared after order confirmation based on current queue.
Support terms
Complete documentation, setup guide, and viva preparation included. Support for setup and explanation provided.