
More project photos (2)
The problem
Diabetic retinopathy is one of the leading causes of preventable blindness, and it progresses silently — by the time vision blurs, the damage is often irreversible. Catching it early requires a trained ophthalmologist to examine retinal fundus photographs, but ophthalmologists are scarce, concentrated in cities, and the screening simply does not reach most diabetic patients in time. This is a pattern-matching problem at its core: the disease announces itself through visible lesions — microaneurysms, haemorrhages, exudates — scattered across the retina. Convolutional networks are well suited to exactly this kind of graded visual judgment, and public datasets like APTOS make it trainable as a student project. This build trains a CNN to grade fundus images across five severity levels, shows which lesions drove each decision through Grad-CAM heatmaps, and wraps it in a screening app — an assistive triage tool, explicitly not a diagnosis device.
How it works
- A fundus photograph is uploaded to the RetinaScan app (or selected from a batch folder).
- Preprocessing: the circular retinal region is cropped, resized to the model's input size, and enhanced with CLAHE to sharpen vessels and lesions.
- The image passes through the fine-tuned CNN backbone (EfficientNet/ResNet) trained with transfer learning.
- A classification head outputs probabilities for each of the five DR severity grades; the top grade and its confidence are selected.
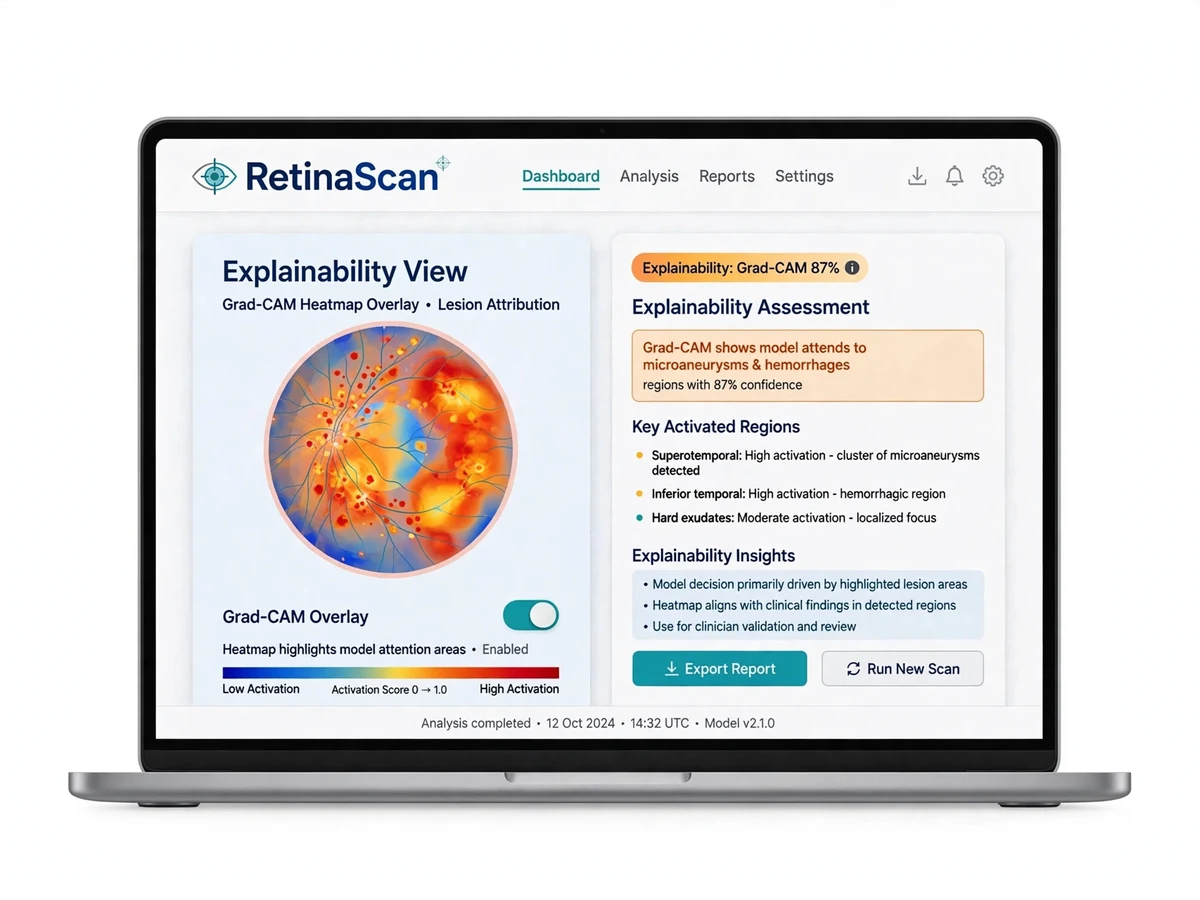
- Grad-CAM computes an activation heatmap from the final convolutional layer, highlighting the lesion regions that drove the decision.
- The app displays the grade badge, confidence, per-grade probabilities and the heatmap toggle.
- Results are saved to the screening log with timestamps; the dashboard aggregates grade distribution for the session.
Project features
- Five-grade DR classification (no DR / mild / moderate / severe / proliferative) from fundus photos
- Transfer learning on EfficientNet/ResNet backbone, fine-tuned on the APTOS 2019 dataset
- Grad-CAM lesion heatmaps overlaid on the retinal image for explainability
- Confidence score with every prediction and per-grade probability breakdown
- RetinaScan Streamlit app: image upload, drag-and-drop batch screening, result cards
- Fundus image preprocessing: circular crop, contrast enhancement (CLAHE), artifact removal
- Class-imbalance handling with weighted loss and data augmentation (rotations, flips, zooms)
- Screening dashboard with grade distribution charts and patient screening history
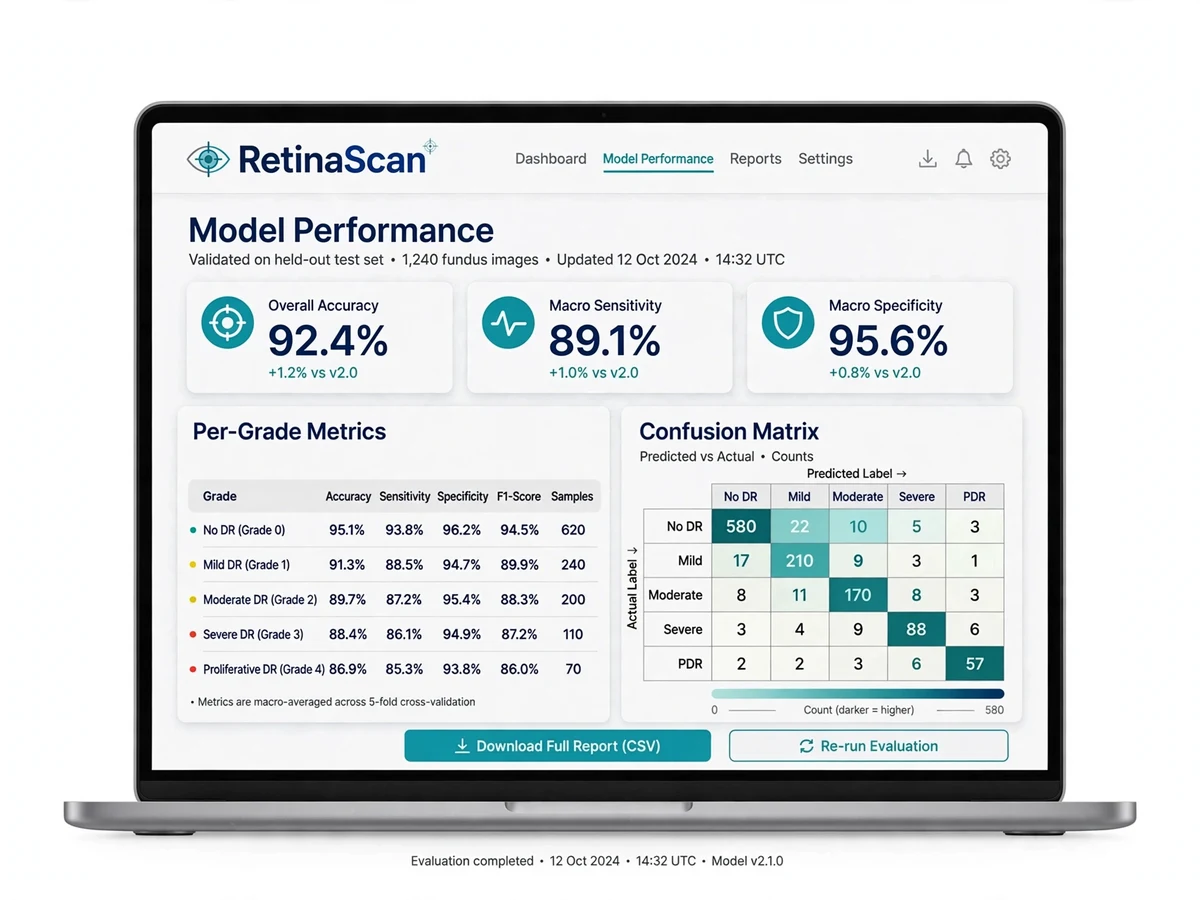
- Per-grade precision, recall and confusion matrix computed on a held-out test set
- Referral recommendation flag: moderate DR and above triggers a "consult an ophthalmologist" alert
What is included
- Complete, commented Python source code (preprocessing, training, evaluation, app)
- Trained CNN model weights (fine-tuned on APTOS) ready to load and demo
- RetinaScan Streamlit web application with screening dashboard
- Project report PDF (literature survey, methodology, dataset analysis, results, per-grade metrics)
- PPT presentation
- Viva Q&A document (transfer learning, Grad-CAM, kappa metric, medical-imaging pitfalls)
- Setup guide (environment, dependencies, dataset download steps)
FAQs
- Why is diabetic retinopathy a good deep-learning topic? It is a graded visual classification problem on a real clinical dataset (APTOS), with transfer learning, class-imbalance handling and Grad-CAM explainability — each a substantial technical chapter in the report.
- Which dataset is used? The APTOS 2019 blindness-detection dataset from Kaggle (3,662 labelled fundus images, five severity grades), with EyePACS covered in the literature survey.
- Is a GPU needed? Only for training — free Kaggle/Colab GPUs are enough for fine-tuning. The delivered trained model runs inference on a normal CPU laptop in seconds.
- What does Grad-CAM add? It shows which retinal regions the model attended to for each grade — the explainability answer to "how does the model decide," displayed as a heatmap over microaneurysms, haemorrhages and exudates.
- Can it be demoed live? Yes — the RetinaScan app takes any fundus photo and shows the severity grade, confidence and heatmap; a sample test set is included.
- What are the natural extensions? Multi-label lesion detection, a mobile screening app, OCT-image support, or federated learning across hospitals.
Limitations & prerequisites
- Accuracy depends heavily on image quality — blurred, overexposed or poorly cropped fundus photos degrade grading.
- The APTOS dataset has severe class imbalance (proliferative cases are rare); performance is weakest on the severe classes.
- This is a screening aid, not a diagnostic device — it cannot replace an ophthalmologist and must never be presented as one.
- Grad-CAM heatmaps are approximate localizations, not clinical lesion segmentations.
Components & software requirements
- Python 3.9+ (NumPy, Pandas, scikit-learn)
- TensorFlow/Keras (EfficientNet/ResNet transfer learning, fine-tuning)
- OpenCV (fundus preprocessing, circular crop, CLAHE)
- Streamlit (RetinaScan screening app)
- Matplotlib/Seaborn (confusion matrix, training curves, grade distribution charts)
- Grad-CAM implementation for lesion heatmaps
Specifications
| Parameter | Value |
|---|---|
| Task | 5-class severity grading: no DR, mild, moderate, severe, proliferative |
| Dataset | APTOS 2019 blindness detection (Kaggle) + EyePACS reference |
| Model | EfficientNet/ResNet backbone, transfer learning with fine-tuned top layers |
| Input | Fundus photographs (JPEG/PNG), resized to 224×224 / 384×384 |
| Test accuracy | ~78–86% five-class accuracy on held-out APTOS test split; documented per grade |
| Key metric | Quadratic weighted kappa (~0.80–0.88) — the standard DR competition metric |
| Explainability | Grad-CAM heatmaps over microaneurysms, haemorrhages and exudates |
| Augmentation | Rotation, horizontal flip, zoom, brightness jitter for class imbalance |
| Web app | Streamlit; single-image screening, batch mode, screening dashboard |
| Disclaimer | Screening aid only; every moderate+ case flags ophthalmologist referral |