
More project photos (2)
The problem
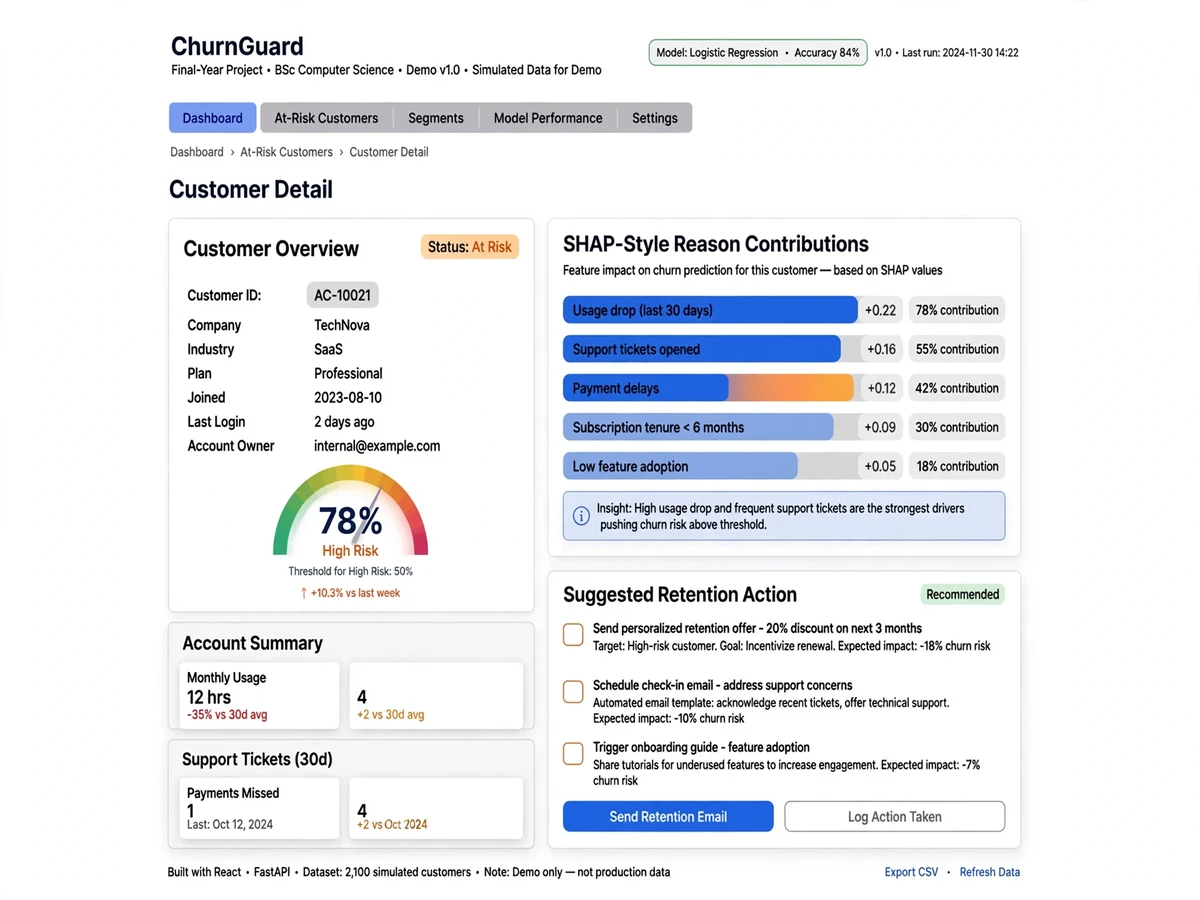
Customer Churn Prediction using Machine Learning is a business-analytics final year project that flags which customers are likely to cancel, why they are leaving, and what retention actions could change the outcome. Built on telecom-style customer records (tenure, monthly charges, contract type, support tickets, subscribed services), an XGBoost classifier learns churn patterns while class-imbalance techniques keep the minority churn class from being ignored. Everything is served through a Streamlit dashboard branded ChurnGuard: churn-risk segments, SHAP-ranked churn drivers, revenue-at-risk summaries and a what-if simulator that shows how a retention offer moves an individual customer's risk score. Because churn analytics maps directly to real industry roles, this is a project recruiters — and viva examiners — instantly understand.
This is a built-to-order project: the code, trained models, report, PPT and viva Q&A are prepared and quality-checked for your order.
How it works
- Telecom-style customer records are loaded and cleaned: contract types encoded, charges scaled, tenure binned, missing values imputed.
- The data is split with stratification so the churn minority keeps its share in train and test sets.
- An XGBoost classifier is trained with scale_pos_weight set from the class ratio, then tuned (max_depth, learning_rate, min_child_weight) via cross-validation.
- The decision threshold is tuned on the validation set to favour recall on churners — missing a churner costs more than a false alarm.
- SHAP values explain every prediction; the ChurnGuard dashboard turns scores, segments, drivers and what-if simulations into an interactive retention tool.
Project features
- Per-customer churn probability scoring with adjustable decision threshold
- Risk segmentation (high / medium / low) with customer counts and revenue-at-risk rollups
- SHAP-ranked churn drivers — e.g. month-to-month contract, short tenure, high monthly charges, frequent support tickets
- What-if retention simulator: change contract type, tenure or support-call count and watch the risk score move
- Class-imbalance handling: scale_pos_weight, stratified splits, optional SMOTE — compared explicitly in the notebook
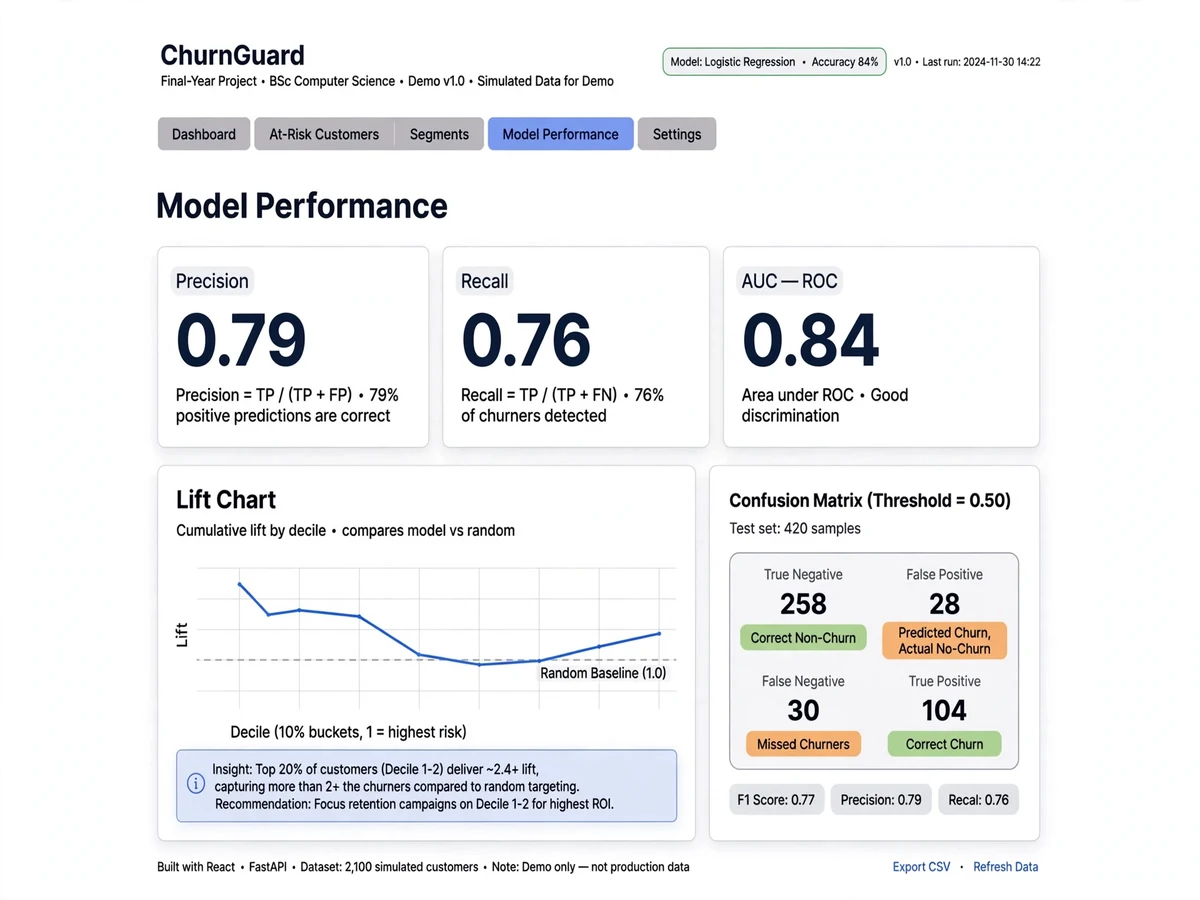
- Proper classification metrics: precision, recall, F1, ROC-AUC and PR curves, with threshold tuning aimed at churn-class recall
- Streamlit dashboard (ChurnGuard) with filters by segment, contract type and tenure band
- Retention-action mapping: each top driver links to a suggested business action (contract upgrade offer, proactive support call)
What is included
- Full source code (training notebooks + Streamlit dashboard, well-commented)
- Trained model files (.pkl) — the dashboard runs without retraining
- Project report PDF (synopsis, literature survey, methodology, results, conclusion, business interpretation)
- PPT presentation for the final review
- Viva Q&A preparation document (imbalance handling, XGBoost internals, SHAP, precision-recall trade-offs)
- Setup guide (environment, dependencies, running the dashboard locally)
FAQs
- Why not just report accuracy for this churn prediction project? With ~70%+ non-churners, a model predicting "nobody churns" scores 70% accuracy while being useless. The project optimizes and reports precision, recall, F1 and ROC-AUC instead — and the viva Q&A arms you to explain exactly why accuracy misleads on imbalanced data.
- How is class imbalance handled — SMOTE or scale_pos_weight? Both are implemented and compared: scale_pos_weight (cheap, no synthetic data) versus SMOTE oversampling. You can present the trade-off table in your review — examiners love this question.
- What does SHAP add beyond feature importance? Built-in importance says which features matter globally; SHAP explains individual predictions — why this customer is high-risk — which powers the what-if simulator and the retention-action mapping.
- How is the decision threshold chosen? By scanning thresholds on the validation set and picking the point that maximizes churn-class recall subject to an acceptable precision floor, since a missed churner costs more than an unnecessary retention call.
- Can I run the dashboard offline for my review? Yes — trained models ship as .pkl files and Streamlit runs locally, so the full demo works without internet.
- What extensions impress examiners? Cohort analysis (churn by tenure band over time), a cost-based threshold optimizer using real retention-offer costs, or survival analysis for when a customer will churn. Ask us to scope any of these.
Limitations & prerequisites
- The model finds correlational churn drivers, not proven causes — a retention offer's true effect needs an A/B test, which the what-if simulator approximates, not guarantees.
- Demo data is telecom-style; results on a real company's data would differ in feature mix and churn base rate.
- Churn behaviour drifts (new plans, competitors), so the model needs periodic retraining on fresh data.
- Revenue-at-risk figures are illustrative estimates from charges in the dataset, not audited financials.
Components & software requirements
- Python 3, pandas, NumPy for data wrangling
- scikit-learn: stratified splits, pipelines, precision/recall/F1, ROC and PR curves
- XGBoost (XGBClassifier) with scale_pos_weight for imbalance
- imbalanced-learn (SMOTE) for oversampling comparison
- SHAP for global and per-customer explanations
- Streamlit for the ChurnGuard dashboard
- Matplotlib / Plotly for EDA and dashboard charts
| Parameter | Value |
|---|---|
| Problem type | Binary classification (churn / no-churn) |
| Dataset | Telecom-style customer records: tenure, monthly/total charges, contract, support tickets, services |
| Class balance | Typically ~25–30% churners; handled with scale_pos_weight / SMOTE + stratified splitting |
| Primary model | XGBoost classifier, tuned via cross-validation (max_depth, learning_rate, min_child_weight, scale_pos_weight) |
| Threshold strategy | Tuned for churn-class recall (missing a churner is costlier than a false alarm) |
| Metrics | Precision, Recall, F1, ROC-AUC, PR-AUC — reported from the actual training run |
| Explainability | SHAP summary plots + per-customer contribution breakdowns |
| Dashboard | Streamlit (ChurnGuard): segments, drivers, revenue at risk, what-if simulator |